Sallie Mae 2015 Annual Report Download - page 135
Download and view the complete annual report
Please find page 135 of the 2015 Sallie Mae annual report below. You can navigate through the pages in the report by either clicking on the pages listed below, or by using the keyword search tool below to find specific information within the annual report.-
 1
1 -
2
-
3
-
4
-
5
-
6
-
7
-
8
-
9
-
10
-
11
-
12
-
13
-
14
-
15
-
16
-
17
-
18
-
19
-
20
-
21
-
22
-
23
-
24
-
25
-
26
-
27
-
28
-
29
-
30
-
31
-
32
-
33
-
34
-
35
-
36
-
37
-
38
-
39
-
40
-
41
-
42
-
43
-
44
-
45
-
46
-
47
-
48
-
49
-
50
-
51
-
52
-
53
-
54
-
55
-
56
-
57
-
58
-
59
-
60
-
61
-
62
-
63
-
64
-
65
-
66
-
67
-
68
-
69
-
70
-
71
-
72
-
73
-
74
-
75
-
76
-
77
-
78
-
79
-
80
-
81
-
82
-
83
-
84
-
85
-
86
-
87
-
88
-
89
-
90
-
91
-
92
-
93
-
94
-
95
-
96
-
97
-
98
-
99
-
100
-
101
-
102
-
103
-
104
-
105
-
106
-
107
-
108
-
109
-
110
-
111
-
112
-
113
-
114
-
115
-
116
-
117
-
118
-
119
-
120
-
121
-
122
-
123
-
124
-
 125
125 -
 126
126 -
 127
127 -
 128
128 -
 129
129 -
 130
130 -
 131
131 -
 132
132 -
 133
133 -
 134
134 -
 135
135 -
 136
136 -
 137
137 -
 138
138 -
 139
139 -
 140
140 -
 141
141 -
 142
142 -
 143
143 -
 144
144 -
 145
145 -
146
-
147
-
148
-
149
-
150
-
151
-
152
-
153
-
154
-
155
-
156
-
157
-
158
-
159
-
160
-
161
-
162
-
163
-
164
-
165
-
166
-
167
-
168
-
169
-
170
-
171
-
172
-
173
-
174
-
175
-
176
-
177
-
178
-
179
-
180
-
181
-
182
-
183
-
184
-
185
-
186
-
187
-
188
-
189
-
190
-
191
-
192
-
193
-
194
-
195
-
196
-
197
-
198
-
199
-
200
-
201
-
202
-
203
-
204
-
205
-
206
-
207
-
208
-
209
-
210
-
211
-
212
-
213
-
214
-
215
-
216
-
217
-
218
-
219
-
220
-
221
-
222
-
223
-
224
-
225
-
226
-
227
-
228
-
229
-
230
-
231
-
232
-
233
-
234
-
235
-
236
-
237
-
238
-
239
-
240
-
241
-
242
-
243
-
244
-
245
-
246
-
247
-
248
-
249
-
250
-
251
-
252
-
253
-
254
-
255
-
256
-
257
 |
 |

SLM CORPORATION
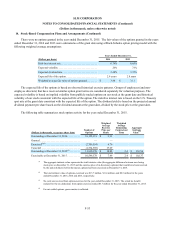
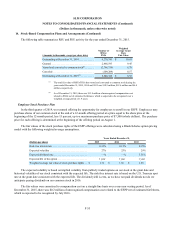
NOTES TO CONSOLIDATED FINANCIAL STATEMENTS (Continued)
(Dollars in thousands, unless otherwise noted)
11. Derivative Financial Instruments (Continued)
F-45
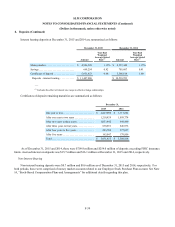
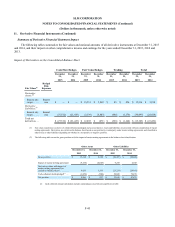
Summary of Derivative Financial Statement Impact
The following tables summarize the fair values and notional amounts of all derivative instruments at December 31, 2015
and 2014, and their impact on other comprehensive income and earnings for the years ended December 31, 2015, 2014 and
2013.
Impact of Derivatives on the Consolidated Balance Sheet
Cash Flow Hedges Fair Value Hedges Trading Total
December
31, December
31, December
31, December
31, December
31, December
31, December
31, December
31,
2015 2014 2015 2014 2015 2014 2015 2014
Fair Values(1)
Hedged
Risk
Exposure
Derivative
Assets:(2)
Interest rate
swaps . . . . . Interest
rate $ — $ — $ 15,231 $ 5,012 $ 83 $ 226 $ 15,314 $ 5,238
Derivative
Liabilities:(2)
Interest rate
swaps . . . . . Interest
rate (27,512) (21,435) (2,339) (5,883) (646) (1,370) (30,497) (28,688)
Total net
derivatives. . . $ (27,512) $ (21,435) $ 12,892 $ (871) $ (563) $ (1,144) $ (15,183) $ (23,450)
(1) Fair values reported are exclusive of collateral held and pledged and accrued interest. Assets and liabilities are presented without consideration of master
netting agreements. Derivatives are carried on the balance sheet based on net position by counterparty under master netting agreements, and classified in
other assets or other liabilities depending on whether in a net positive or negative position.
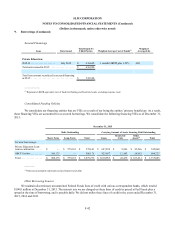
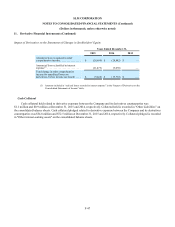
(2) The following table reconciles gross positions with the impact of master netting agreements to the balance sheet classification:
Other Assets Other Liabilities
December 31, December 31, December 31, December 31,
2015 2014 2015 2014
Gross position . . . . . . . . . . . . . . . . . $ 15,314 $ 5,238 $ (30,497) $ (28,688)
Impact of master netting agreement (9,278) (4,045) 9,278 4,045
Derivative values with impact of
master netting agreements (as
carried on balance sheet) . . . . . . . . . 6,036 1,193 (21,219) (24,643)
Cash collateral (held) pledged(1) . . . (1,070) (900) 54,845 72,478
Net position . . . . . . . . . . . . . . . . . . . $ 4,966 $ 293 $ 33,626 $ 47,835
(1) Cash collateral amount calculations include outstanding accrued interest payable/receivable.