Sallie Mae 2015 Annual Report Download - page 251
Download and view the complete annual report
Please find page 251 of the 2015 Sallie Mae annual report below. You can navigate through the pages in the report by either clicking on the pages listed below, or by using the keyword search tool below to find specific information within the annual report.-
 1
1 -
2
-
3
-
4
-
5
-
6
-
7
-
8
-
9
-
10
-
11
-
12
-
13
-
14
-
15
-
16
-
17
-
18
-
19
-
20
-
21
-
22
-
23
-
24
-
25
-
26
-
27
-
28
-
29
-
30
-
31
-
32
-
33
-
34
-
35
-
36
-
37
-
38
-
39
-
40
-
41
-
42
-
43
-
44
-
45
-
46
-
47
-
48
-
49
-
50
-
51
-
52
-
53
-
54
-
55
-
56
-
57
-
58
-
59
-
60
-
61
-
62
-
63
-
64
-
65
-
66
-
67
-
68
-
69
-
70
-
71
-
72
-
73
-
74
-
75
-
76
-
77
-
78
-
79
-
80
-
81
-
82
-
83
-
84
-
85
-
86
-
87
-
88
-
89
-
90
-
91
-
92
-
93
-
94
-
95
-
96
-
97
-
98
-
99
-
100
-
101
-
102
-
103
-
104
-
105
-
106
-
107
-
108
-
109
-
110
-
111
-
112
-
113
-
114
-
115
-
116
-
117
-
118
-
119
-
120
-
121
-
122
-
123
-
124
-
125
-
126
-
127
-
128
-
129
-
130
-
131
-
132
-
133
-
134
-
135
-
136
-
137
-
138
-
139
-
140
-
141
-
142
-
143
-
144
-
145
-
146
-
147
-
148
-
149
-
150
-
151
-
152
-
153
-
154
-
155
-
156
-
157
-
158
-
159
-
160
-
161
-
162
-
163
-
164
-
165
-
166
-
167
-
168
-
169
-
170
-
171
-
172
-
173
-
174
-
175
-
176
-
177
-
178
-
179
-
180
-
181
-
182
-
183
-
184
-
185
-
186
-
187
-
188
-
189
-
190
-
191
-
192
-
193
-
194
-
195
-
196
-
197
-
198
-
199
-
200
-
201
-
202
-
203
-
204
-
205
-
206
-
207
-
208
-
209
-
210
-
211
-
212
-
213
-
214
-
215
-
216
-
217
-
218
-
219
-
220
-
221
-
222
-
223
-
224
-
225
-
226
-
227
-
228
-
229
-
230
-
231
-
232
-
233
-
234
-
235
-
236
-
237
-
238
-
239
-
240
-
 241
241 -
 242
242 -
 243
243 -
 244
244 -
 245
245 -
 246
246 -
 247
247 -
 248
248 -
 249
249 -
 250
250 -
 251
251 -
 252
252 -
 253
253 -
 254
254 -
 255
255 -
 256
256 -
 257
257
 |
 |
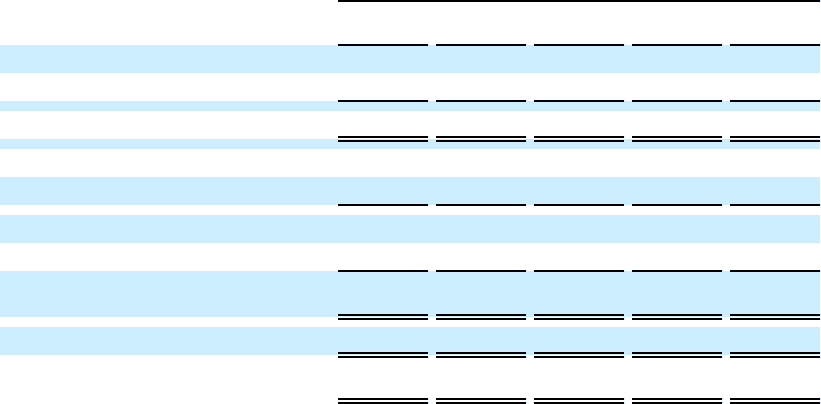
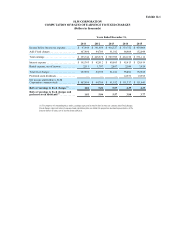
Exhibit 12.1
SLM CORPORATION
COMPUTATION OF RATIO OF EARNINGS TO FIXED CHARGES
(Dollars in thousands)
Years Ended December 31,
2011 2012 2013 2014 2015
Income before income tax expense . . . . . . . $ 87,848 $ 341,869 $ 416,527 $ 333,752 $ 439,064
Add: Fixed charges. . . . . . . . . . . . . . . . . . . . 107,896 84,709 91,182 98,404 132,048
Total earnings . . . . . . . . . . . . . . . . . . . . . . . . $ 195,744 $ 426,578 $ 507,709 $ 432,156 $ 571,112
Interest expense . . . . . . . . . . . . . . . . . . . . . . $ 105,385 $ 82,912 $ 89,085 $ 95,815 $ 128,619
Rental expense, net of income . . . . . . . . . . . 2,511 1,797 2,097 2,589 3,429
Total fixed charges . . . . . . . . . . . . . . . . . . . . 107,896 84,709 91,182 98,404 132,048
Preferred stock dividends . . . . . . . . . . . . . . . — — — 12,933 19,595
Net income attributable to SLM
Corporation common stock . . . . . . . . . . . . . $ 107,896 $ 84,709 $ 91,182 $ 111,337 $ 151,643
Ratio of earnings to fixed charges(1) . . . . . 1.81 5.04 5.57 4.39 4.33
Ratio of earnings to fixed charges and
preferred stock dividends(1) . . . . . . . . . . . . 1.81 5.04 5.57 3.88 3.77
(1) For purposes of computing these ratios, earnings represent income before income tax expense plus fixed charges.
Fixed charges represent interest expensed and capitalized plus one-third (the proportion deemed representative of the
interest factor) of rents, net of income from subleases.