Sallie Mae 2015 Annual Report Download - page 55
Download and view the complete annual report
Please find page 55 of the 2015 Sallie Mae annual report below. You can navigate through the pages in the report by either clicking on the pages listed below, or by using the keyword search tool below to find specific information within the annual report.-
 1
1 -
2
-
3
-
4
-
5
-
6
-
7
-
8
-
9
-
10
-
11
-
12
-
13
-
14
-
15
-
16
-
17
-
18
-
19
-
20
-
21
-
22
-
23
-
24
-
25
-
26
-
27
-
28
-
29
-
30
-
31
-
32
-
33
-
34
-
35
-
36
-
37
-
38
-
39
-
40
-
41
-
42
-
43
-
44
-
 45
45 -
 46
46 -
 47
47 -
 48
48 -
 49
49 -
 50
50 -
 51
51 -
 52
52 -
 53
53 -
 54
54 -
 55
55 -
 56
56 -
 57
57 -
 58
58 -
 59
59 -
 60
60 -
 61
61 -
 62
62 -
 63
63 -
 64
64 -
 65
65 -
66
-
67
-
68
-
69
-
70
-
71
-
72
-
73
-
74
-
75
-
76
-
77
-
78
-
79
-
80
-
81
-
82
-
83
-
84
-
85
-
86
-
87
-
88
-
89
-
90
-
91
-
92
-
93
-
94
-
95
-
96
-
97
-
98
-
99
-
100
-
101
-
102
-
103
-
104
-
105
-
106
-
107
-
108
-
109
-
110
-
111
-
112
-
113
-
114
-
115
-
116
-
117
-
118
-
119
-
120
-
121
-
122
-
123
-
124
-
125
-
126
-
127
-
128
-
129
-
130
-
131
-
132
-
133
-
134
-
135
-
136
-
137
-
138
-
139
-
140
-
141
-
142
-
143
-
144
-
145
-
146
-
147
-
148
-
149
-
150
-
151
-
152
-
153
-
154
-
155
-
156
-
157
-
158
-
159
-
160
-
161
-
162
-
163
-
164
-
165
-
166
-
167
-
168
-
169
-
170
-
171
-
172
-
173
-
174
-
175
-
176
-
177
-
178
-
179
-
180
-
181
-
182
-
183
-
184
-
185
-
186
-
187
-
188
-
189
-
190
-
191
-
192
-
193
-
194
-
195
-
196
-
197
-
198
-
199
-
200
-
201
-
202
-
203
-
204
-
205
-
206
-
207
-
208
-
209
-
210
-
211
-
212
-
213
-
214
-
215
-
216
-
217
-
218
-
219
-
220
-
221
-
222
-
223
-
224
-
225
-
226
-
227
-
228
-
229
-
230
-
231
-
232
-
233
-
234
-
235
-
236
-
237
-
238
-
239
-
240
-
241
-
242
-
243
-
244
-
245
-
246
-
247
-
248
-
249
-
250
-
251
-
252
-
253
-
254
-
255
-
256
-
257
 |
 |

53
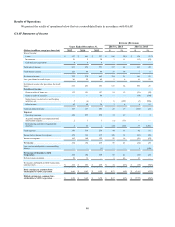
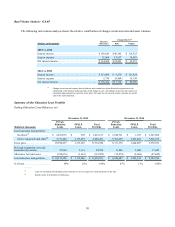
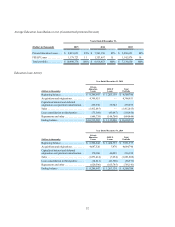
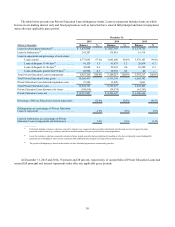
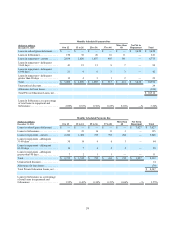
Year Ended December 31, 2013
(Dollars in thousands)
Private
Education
Loans FFELP
Loans Total
Portfolio
Beginning balance. . . . . . . . . . . . . . . . . . $ 5,447,699 $ 1,039,755 $ 6,487,454
Acquisitions and originations . . . . . . . . . 3,803,262 478,384 4,281,646
Capitalized interest and deferred
origination cost premium amortization . . 112,122 49,313 161,435
Sales . . . . . . . . . . . . . . . . . . . . . . . . . . . . (2,347,521) (1,182) (2,348,703)
Loan consolidation to third-parties . . . . . (13,445) (23,456) (36,901)
Repayments and other. . . . . . . . . . . . . . . (495,475) (118,079) (613,554)
Ending balance . . . . . . . . . . . . . . . . . . . . $ 6,506,642 $ 1,424,735 $ 7,931,377
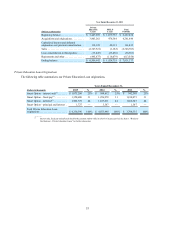
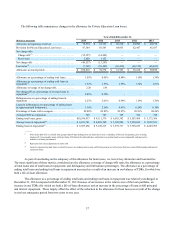
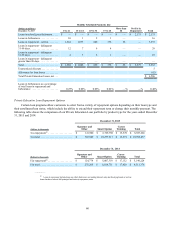
Private Education Loan Originations
The following table summarizes our Private Education Loan originations.
Years Ended December 31,
(Dollars in thousands) 2015 % 2014 % 2013 %
Smart Option - interest only(1). . . . . . . $ 1,075,260 25% $ 998,612 25% $ 942,568 25%
Smart Option - fixed pay(1) . . . . . . . . . 1,350,680 31 1,256,978 31 1,184,073 31
Smart Option - deferred(1) . . . . . . . . . . 1,902,729 44 1,817,011 44 1,666,547 44
Smart Option - principal and interest . 1,727 — 3,347 — 1,347 —
Total Private Education Loan
originations . . . . . . . . . . . . . . . . . . . . . $ 4,330,396 100% $ 4,075,948 100% $ 3,794,535 100%
________
(1) Interest only, fixed pay and deferred describe the payment option while in school or in grace period. See Item 1. “Business -
Our Business - Private Education Loans” for further discussion.