Sallie Mae 2015 Annual Report Download - page 107
Download and view the complete annual report
Please find page 107 of the 2015 Sallie Mae annual report below. You can navigate through the pages in the report by either clicking on the pages listed below, or by using the keyword search tool below to find specific information within the annual report.-
 1
1 -
2
-
3
-
4
-
5
-
6
-
7
-
8
-
9
-
10
-
11
-
12
-
13
-
14
-
15
-
16
-
17
-
18
-
19
-
20
-
21
-
22
-
23
-
24
-
25
-
26
-
27
-
28
-
29
-
30
-
31
-
32
-
33
-
34
-
35
-
36
-
37
-
38
-
39
-
40
-
41
-
42
-
43
-
44
-
45
-
46
-
47
-
48
-
49
-
50
-
51
-
52
-
53
-
54
-
55
-
56
-
57
-
58
-
59
-
60
-
61
-
62
-
63
-
64
-
65
-
66
-
67
-
68
-
69
-
70
-
71
-
72
-
73
-
74
-
75
-
76
-
77
-
78
-
79
-
80
-
81
-
82
-
83
-
84
-
85
-
86
-
87
-
88
-
89
-
90
-
91
-
92
-
93
-
94
-
95
-
96
-
 97
97 -
 98
98 -
 99
99 -
 100
100 -
 101
101 -
 102
102 -
 103
103 -
 104
104 -
 105
105 -
 106
106 -
 107
107 -
 108
108 -
 109
109 -
 110
110 -
 111
111 -
 112
112 -
 113
113 -
 114
114 -
 115
115 -
 116
116 -
 117
117 -
118
-
119
-
120
-
121
-
122
-
123
-
124
-
125
-
126
-
127
-
128
-
129
-
130
-
131
-
132
-
133
-
134
-
135
-
136
-
137
-
138
-
139
-
140
-
141
-
142
-
143
-
144
-
145
-
146
-
147
-
148
-
149
-
150
-
151
-
152
-
153
-
154
-
155
-
156
-
157
-
158
-
159
-
160
-
161
-
162
-
163
-
164
-
165
-
166
-
167
-
168
-
169
-
170
-
171
-
172
-
173
-
174
-
175
-
176
-
177
-
178
-
179
-
180
-
181
-
182
-
183
-
184
-
185
-
186
-
187
-
188
-
189
-
190
-
191
-
192
-
193
-
194
-
195
-
196
-
197
-
198
-
199
-
200
-
201
-
202
-
203
-
204
-
205
-
206
-
207
-
208
-
209
-
210
-
211
-
212
-
213
-
214
-
215
-
216
-
217
-
218
-
219
-
220
-
221
-
222
-
223
-
224
-
225
-
226
-
227
-
228
-
229
-
230
-
231
-
232
-
233
-
234
-
235
-
236
-
237
-
238
-
239
-
240
-
241
-
242
-
243
-
244
-
245
-
246
-
247
-
248
-
249
-
250
-
251
-
252
-
253
-
254
-
255
-
256
-
257
 |
 |
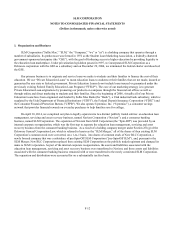
SLM CORPORATION
NOTES TO CONSOLIDATED FINANCIAL STATEMENTS (Continued)
(Dollars in thousands, unless otherwise noted)
2. Significant Accounting Policies (Continued)
F-17
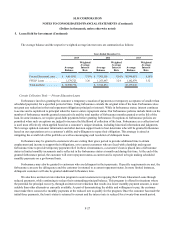
Key Credit Quality Indicators
We determine the collectability of our Private Education Loan portfolio by evaluating certain risk characteristics. We
consider credit score, existence of a cosigner, loan status and loan seasoning as the key credit quality indicators because they
have the most significant effect on the determination of the adequacy of our allowance for loan losses. Credit scores are an
indicator of the creditworthiness of a borrower and the higher the credit score the more likely it is the borrower will be able to
make all of their contractual payments. Loan status affects the credit risk because a past due loan is more likely to result in a
credit loss than an up-to-date loan. Additionally, loans in the deferred payment status have different credit risk profiles
compared with those in current pay status. Loan seasoning affects credit risk because a loan with a history of making payments
generally has a lower incidence of default than a loan with a history of making infrequent or no payments. The existence of a
cosigner lowers the likelihood of default. We monitor and update these credit quality indicators in the analysis of the adequacy
of our allowance for loan losses on a quarterly basis.
Certain Private Education Loans do not require borrowers to begin repayment until six months after they have graduated
or otherwise left school. Consequently, the loss estimates for these loans is generally low while the borrower is in school. At
December 31, 2015 and 2014, 32 percent and 36 percent, respectively, of the principal balance in the Private Education Loan
portfolio was related to borrowers who are in an in-school (fully deferred), grace, or deferment status and not required to make
payments. As this population of borrowers leaves school, they will be required to begin payments on their loans, and the
allowance for losses may change accordingly.
Similar to the rules governing FFELP payment requirements, our collection policies allow for periods of nonpayment for
borrowers requesting additional payment grace periods upon leaving school or experiencing temporary difficulty meeting
payment obligations. This is referred to as forbearance status and is considered separately in the allowance for loan losses. The
loss emergence period is in alignment with the typical collection cycle and takes into account these periods of nonpayment.
As part of concluding on the adequacy of the allowance for loan loss, we review key allowance and loan metrics. The
most relevant of these metrics considered are the allowance coverage of charge-offs ratio; the allowance as a percentage of total
loans and of loans in repayment; and delinquency and forbearance percentages.
We consider a loan to be delinquent 31 days after the last payment was contractually due. We use a model to estimate the
amount of uncollectible accrued interest on Private Education Loans and reserve for that amount against current period interest
income.
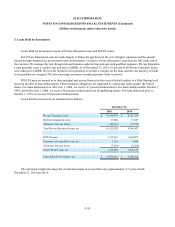
Allowance for FFELP Loan Losses
FFELP Loans are insured as to their principal and accrued interest in the event of default subject to a Risk Sharing level
based on the date of loan disbursement. These insurance obligations are supported by contractual rights against the United
States. For loans disbursed on or after July 1, 2006, we receive 97 percent reimbursement. For loans disbursed after October 1,
1993, and before July 1, 2006, we receive 98 percent reimbursement on all qualifying default claims. For loans disbursed prior
to October 1, 1993, we receive 100 percent reimbursement.
The allowance for FFELP Loan losses uses historical experience of customer default behavior and a two-year loss
emergence period to estimate the credit losses incurred in the loan portfolio at the reporting date. We apply the default rate
projections, net of applicable Risk Sharing, to each category for the current period to perform our quantitative calculation. Once
the quantitative calculation is performed, we review the adequacy of the allowance for loan losses and determine if qualitative
adjustments need to be considered.