Sallie Mae 2015 Annual Report Download - page 36
Download and view the complete annual report
Please find page 36 of the 2015 Sallie Mae annual report below. You can navigate through the pages in the report by either clicking on the pages listed below, or by using the keyword search tool below to find specific information within the annual report.-
 1
1 -
2
-
3
-
4
-
5
-
6
-
7
-
8
-
9
-
10
-
11
-
12
-
13
-
14
-
15
-
16
-
17
-
18
-
19
-
20
-
21
-
22
-
23
-
24
-
25
-
 26
26 -
 27
27 -
 28
28 -
 29
29 -
 30
30 -
 31
31 -
 32
32 -
 33
33 -
 34
34 -
 35
35 -
 36
36 -
 37
37 -
 38
38 -
 39
39 -
 40
40 -
 41
41 -
 42
42 -
 43
43 -
 44
44 -
 45
45 -
 46
46 -
47
-
48
-
49
-
50
-
51
-
52
-
53
-
54
-
55
-
56
-
57
-
58
-
59
-
60
-
61
-
62
-
63
-
64
-
65
-
66
-
67
-
68
-
69
-
70
-
71
-
72
-
73
-
74
-
75
-
76
-
77
-
78
-
79
-
80
-
81
-
82
-
83
-
84
-
85
-
86
-
87
-
88
-
89
-
90
-
91
-
92
-
93
-
94
-
95
-
96
-
97
-
98
-
99
-
100
-
101
-
102
-
103
-
104
-
105
-
106
-
107
-
108
-
109
-
110
-
111
-
112
-
113
-
114
-
115
-
116
-
117
-
118
-
119
-
120
-
121
-
122
-
123
-
124
-
125
-
126
-
127
-
128
-
129
-
130
-
131
-
132
-
133
-
134
-
135
-
136
-
137
-
138
-
139
-
140
-
141
-
142
-
143
-
144
-
145
-
146
-
147
-
148
-
149
-
150
-
151
-
152
-
153
-
154
-
155
-
156
-
157
-
158
-
159
-
160
-
161
-
162
-
163
-
164
-
165
-
166
-
167
-
168
-
169
-
170
-
171
-
172
-
173
-
174
-
175
-
176
-
177
-
178
-
179
-
180
-
181
-
182
-
183
-
184
-
185
-
186
-
187
-
188
-
189
-
190
-
191
-
192
-
193
-
194
-
195
-
196
-
197
-
198
-
199
-
200
-
201
-
202
-
203
-
204
-
205
-
206
-
207
-
208
-
209
-
210
-
211
-
212
-
213
-
214
-
215
-
216
-
217
-
218
-
219
-
220
-
221
-
222
-
223
-
224
-
225
-
226
-
227
-
228
-
229
-
230
-
231
-
232
-
233
-
234
-
235
-
236
-
237
-
238
-
239
-
240
-
241
-
242
-
243
-
244
-
245
-
246
-
247
-
248
-
249
-
250
-
251
-
252
-
253
-
254
-
255
-
256
-
257
 |
 |
34
PART II.
Item 5. Market for Registrant’s Common Equity, Related Stockholder Matters and Issuer Purchases of Equity
Securities
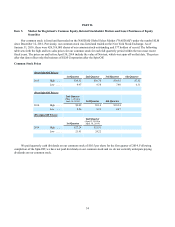
Our common stock is listed and has traded on the NASDAQ Global Select Market ("NASDAQ") under the symbol SLM
since December 12, 2011. Previously, our common stock was listed and traded on the New York Stock Exchange. As of
January 31, 2016, there were 426,316,005 shares of our common stock outstanding and 377 holders of record. The following
table sets forth the high and low sales prices for our common stock for each full quarterly period within the two most recent
fiscal years. The prices on and before April 30, 2014 include the value of Navient, which was spun off on that date. The prices
after that date reflect only the business of SLM Corporation after the Spin-Off.
Common Stock Prices
(Post-Spin-Off Prices)
1st Quarter 2nd Quarter 3rd Quarter 4th Quarter
2015 High . . . . . $10.32 $10.70 $10.02 $7.32
Low . . . . . 8.97 9.38 7.40 6.31
(Post-Spin-Off Prices)
2nd Quarter
(May 1, 2014 to
June 30, 2014) 3rd Quarter 4th Quarter
2014 High . . . . . $9.09 $9.14 $10.34
Low . . . . . 8.26 8.23 8.47
(Pre-Spin-Off Prices)
1st Quarter
2nd Quarter
(April 1, 2014 to
April 30, 2014)
2014 High . . . . . $27.24 $25.93
Low . . . . . 21.91 24.22
We paid quarterly cash dividends on our common stock of $0.15 per share for the first quarter of 2014. Following
completion of the Spin-Off, we have not paid dividends on our common stock and we do not currently anticipate paying
dividends on our common stock.