Sallie Mae 2015 Annual Report Download - page 152
Download and view the complete annual report
Please find page 152 of the 2015 Sallie Mae annual report below. You can navigate through the pages in the report by either clicking on the pages listed below, or by using the keyword search tool below to find specific information within the annual report.-
 1
1 -
2
-
3
-
4
-
5
-
6
-
7
-
8
-
9
-
10
-
11
-
12
-
13
-
14
-
15
-
16
-
17
-
18
-
19
-
20
-
21
-
22
-
23
-
24
-
25
-
26
-
27
-
28
-
29
-
30
-
31
-
32
-
33
-
34
-
35
-
36
-
37
-
38
-
39
-
40
-
41
-
42
-
43
-
44
-
45
-
46
-
47
-
48
-
49
-
50
-
51
-
52
-
53
-
54
-
55
-
56
-
57
-
58
-
59
-
60
-
61
-
62
-
63
-
64
-
65
-
66
-
67
-
68
-
69
-
70
-
71
-
72
-
73
-
74
-
75
-
76
-
77
-
78
-
79
-
80
-
81
-
82
-
83
-
84
-
85
-
86
-
87
-
88
-
89
-
90
-
91
-
92
-
93
-
94
-
95
-
96
-
97
-
98
-
99
-
100
-
101
-
102
-
103
-
104
-
105
-
106
-
107
-
108
-
109
-
110
-
111
-
112
-
113
-
114
-
115
-
116
-
117
-
118
-
119
-
120
-
121
-
122
-
123
-
124
-
125
-
126
-
127
-
128
-
129
-
130
-
131
-
132
-
133
-
134
-
135
-
136
-
137
-
138
-
139
-
140
-
141
-
 142
142 -
 143
143 -
 144
144 -
 145
145 -
 146
146 -
 147
147 -
 148
148 -
 149
149 -
 150
150 -
 151
151 -
 152
152 -
 153
153 -
 154
154 -
 155
155 -
 156
156 -
 157
157 -
 158
158 -
 159
159 -
 160
160 -
 161
161 -
 162
162 -
163
-
164
-
165
-
166
-
167
-
168
-
169
-
170
-
171
-
172
-
173
-
174
-
175
-
176
-
177
-
178
-
179
-
180
-
181
-
182
-
183
-
184
-
185
-
186
-
187
-
188
-
189
-
190
-
191
-
192
-
193
-
194
-
195
-
196
-
197
-
198
-
199
-
200
-
201
-
202
-
203
-
204
-
205
-
206
-
207
-
208
-
209
-
210
-
211
-
212
-
213
-
214
-
215
-
216
-
217
-
218
-
219
-
220
-
221
-
222
-
223
-
224
-
225
-
226
-
227
-
228
-
229
-
230
-
231
-
232
-
233
-
234
-
235
-
236
-
237
-
238
-
239
-
240
-
241
-
242
-
243
-
244
-
245
-
246
-
247
-
248
-
249
-
250
-
251
-
252
-
253
-
254
-
255
-
256
-
257
 |
 |

SLM CORPORATION
NOTES TO CONSOLIDATED FINANCIAL STATEMENTS (Continued)
(Dollars in thousands, unless otherwise noted)
17. Regulatory Capital (Continued)
F-62
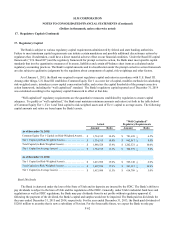
17. Regulatory Capital
The Bank is subject to various regulatory capital requirements administered by federal and state banking authorities.
Failure to meet minimum capital requirements can initiate certain mandatory and possibly additional discretionary actions by
regulators that, if undertaken, could have a direct material adverse effect on our financial condition. Under the Basel III capital
framework (“U.S. Basel III”) and the regulatory framework for prompt corrective action, the Bank must meet specific capital
standards that involve quantitative measures of its assets, liabilities and certain off-balance sheet items as calculated under
regulatory accounting practices. The Bank’s capital amounts and its classification under the prompt corrective action framework
are also subject to qualitative judgments by the regulators about components of capital, risk weightings and other factors.
As of January 1, 2015, the Bank was required to report regulatory capital and ratios in accordance with U.S. Basel III.
Among other things, U.S. Basel III establishes Common Equity Tier 1 as a new tier of capital, modifies methods for calculating
risk-weighted assets, introduces a new capital conservation buffer, and revises the capital thresholds of the prompt corrective
action framework, including the “well capitalized” standard. The Bank’s regulatory capital reported as of December 31, 2014
was calculated according to the regulatory capital framework in effect at that date.
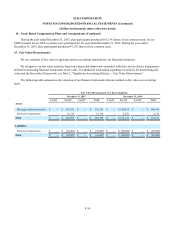
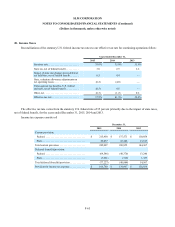
“Well capitalized” regulatory requirements are the quantitative measures established by regulation to ensure capital
adequacy. To qualify as “well capitalized,” the Bank must maintain minimum amounts and ratios (set forth in the table below)
of Common Equity Tier 1, Tier 1 and Total capital to risk-weighted assets and of Tier 1 capital to average assets. The following
capital amounts and ratios are based upon the Bank's assets.
Actual "Well Capitalized"
Regulatory Requirements
Amount Ratio Amount Ratio
As of December 31, 2015:
Common Equity Tier 1 Capital (to Risk-Weighted Assets). . $ 1,734,315 14.4% $ 781,638 > 6.5%
Tier 1 Capital (to Risk-Weighted Assets). . . . . . . . . . . . . . . . $ 1,734,315 14.4% $ 962,017 > 8.0%
Total Capital (to Risk-Weighted Assets). . . . . . . . . . . . . . . . $ 1,848,528 15.4% $ 1,202,521 > 10.0%
Tier 1 Capital (to Average Assets). . . . . . . . . . . . . . . . . . . . . $ 1,734,315 12.3% $ 704,979 > 5.0%
As of December 31, 2014:
Tier 1 Capital (to Risk-Weighted Assets). . . . . . . . . . . . . . . . $ 1,413,988 15.0% $ 565,148 > 6.0%
Total Capital (to Risk-Weighted Assets). . . . . . . . . . . . . . . . $ 1,497,830 15.9% $ 941,913 > 10.0%
Tier 1 Capital (to Average Assets). . . . . . . . . . . . . . . . . . . . . $ 1,413,988 11.5% $ 614,709 > 5.0%
Bank Dividends
The Bank is chartered under the laws of the State of Utah and its deposits are insured by the FDIC. The Bank’s ability to
pay dividends is subject to the laws of Utah and the regulations of the FDIC. Generally, under Utah’s industrial bank laws and
regulations as well as FDIC regulations, the Bank may pay dividends from its net profits without regulatory approval if,
following the payment of the dividend, the Bank’s capital and surplus would not be impaired. The Bank paid no dividends for
the years ended December 31, 2015 and 2014, respectively. For the year ended December 31, 2013, the Bank paid dividends of
$120.0 million to an entity that is now a subsidiary of Navient. For the foreseeable future, we expect the Bank to only pay