Sallie Mae 2015 Annual Report Download - page 56
Download and view the complete annual report
Please find page 56 of the 2015 Sallie Mae annual report below. You can navigate through the pages in the report by either clicking on the pages listed below, or by using the keyword search tool below to find specific information within the annual report.-
 1
1 -
2
-
3
-
4
-
5
-
6
-
7
-
8
-
9
-
10
-
11
-
12
-
13
-
14
-
15
-
16
-
17
-
18
-
19
-
20
-
21
-
22
-
23
-
24
-
25
-
26
-
27
-
28
-
29
-
30
-
31
-
32
-
33
-
34
-
35
-
36
-
37
-
38
-
39
-
40
-
41
-
42
-
43
-
44
-
45
-
 46
46 -
 47
47 -
 48
48 -
 49
49 -
 50
50 -
 51
51 -
 52
52 -
 53
53 -
 54
54 -
 55
55 -
 56
56 -
 57
57 -
 58
58 -
 59
59 -
 60
60 -
 61
61 -
 62
62 -
 63
63 -
 64
64 -
 65
65 -
 66
66 -
67
-
68
-
69
-
70
-
71
-
72
-
73
-
74
-
75
-
76
-
77
-
78
-
79
-
80
-
81
-
82
-
83
-
84
-
85
-
86
-
87
-
88
-
89
-
90
-
91
-
92
-
93
-
94
-
95
-
96
-
97
-
98
-
99
-
100
-
101
-
102
-
103
-
104
-
105
-
106
-
107
-
108
-
109
-
110
-
111
-
112
-
113
-
114
-
115
-
116
-
117
-
118
-
119
-
120
-
121
-
122
-
123
-
124
-
125
-
126
-
127
-
128
-
129
-
130
-
131
-
132
-
133
-
134
-
135
-
136
-
137
-
138
-
139
-
140
-
141
-
142
-
143
-
144
-
145
-
146
-
147
-
148
-
149
-
150
-
151
-
152
-
153
-
154
-
155
-
156
-
157
-
158
-
159
-
160
-
161
-
162
-
163
-
164
-
165
-
166
-
167
-
168
-
169
-
170
-
171
-
172
-
173
-
174
-
175
-
176
-
177
-
178
-
179
-
180
-
181
-
182
-
183
-
184
-
185
-
186
-
187
-
188
-
189
-
190
-
191
-
192
-
193
-
194
-
195
-
196
-
197
-
198
-
199
-
200
-
201
-
202
-
203
-
204
-
205
-
206
-
207
-
208
-
209
-
210
-
211
-
212
-
213
-
214
-
215
-
216
-
217
-
218
-
219
-
220
-
221
-
222
-
223
-
224
-
225
-
226
-
227
-
228
-
229
-
230
-
231
-
232
-
233
-
234
-
235
-
236
-
237
-
238
-
239
-
240
-
241
-
242
-
243
-
244
-
245
-
246
-
247
-
248
-
249
-
250
-
251
-
252
-
253
-
254
-
255
-
256
-
257
 |
 |

54
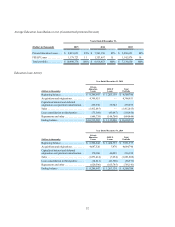
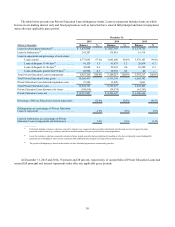
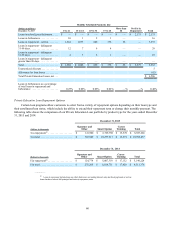
Allowance for Loan Losses
Education Loan Allowance for Loan Losses Activity
Years Ended December 31,
2015 2014 2013
(Dollars in thousands)
Private
Education
Loans FFELP
Loans Total
Portfolio
Private
Education
Loans FFELP
Loans Total
Portfolio
Private
Education
Loans FFELP
Loans Total
Portfolio
Beginning balance. . . . . . . $ 78,574 $ 5,268 $ 83,842 $ 61,763 $ 6,318 $ 68,081 $ 65,218 $ 3,971 $ 69,189
Less:
Charge-offs(1) . . . . . . . . . (55,357) (2,582) (57,939) (14,442) (2,996) (17,438) — (2,037) (2,037)
Loan Sales(2). . . . . . . . . . (7,565) — (7,565) (53,485) — (53,485) (68,410) — (68,410)
Plus:
Recoveries. . . . . . . . . . . . . 5,820 — 5,820 1,155 — 1,155 — — —
Provision . . . . . . . . . . . . . . 87,344 1,005 88,349 83,583 1,946 85,529 64,955 4,384 69,339
Ending balance . . . . . . . . . $ 108,816 $ 3,691 $112,507 $ 78,574 $ 5,268 $ 83,842 $ 61,763 $ 6,318 $ 68,081
Troubled debt
restructuring(3) . . . . . . . $ 265,831 $ — $265,831 $ 60,278 $ — $ 60,278 $ — $ — $ —
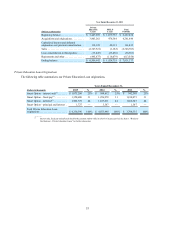
Years Ended December 31,
2012 2011
(Dollars in thousands)
Private
Education
Loans FFELP
Loans Total
Portfolio
Private
Education
Loans FFELP
Loans Total
Portfolio
Beginning balance. . . . . . . $ 69,090 $ 402 $ 69,492 $ 49,738 $ 201 $ 49,939
Less:
Charge-offs(1) . . . . . . . . . — (100) (100) — (98) (98)
Loan Sales(2). . . . . . . . . . (66,319) — (66,319) (65,685) — (65,685)
Plus:
Recoveries. . . . . . . . . . . . . — — — — — —
Provision . . . . . . . . . . . . . . 62,447 3,669 66,116 85,037 299 85,336
Ending balance . . . . . . . . . $ 65,218 $ 3,971 $ 69,189 $ 69,090 $ 402 $ 69,492
Troubled debt
restructuring(3) . . . . . . . $ — $ — $ — $ — $ — $ —
_________
(1) Prior to the Spin-Off, we sold all loans greater than 90 days delinquent to an entity
that is now a subsidiary of Navient Corporation, prior to being charged-off.
Consequently, many of the pre-Spin-Off, historical credit indicators and period-over-
period trends are not comparable and may not be indicative of future performance.
(2) Represents fair value adjustments on loans sold.
(3) Represents the recorded investment of loans classified as troubled debt restructuring.