Sallie Mae 2015 Annual Report Download - page 105
Download and view the complete annual report
Please find page 105 of the 2015 Sallie Mae annual report below. You can navigate through the pages in the report by either clicking on the pages listed below, or by using the keyword search tool below to find specific information within the annual report.-
 1
1 -
2
-
3
-
4
-
5
-
6
-
7
-
8
-
9
-
10
-
11
-
12
-
13
-
14
-
15
-
16
-
17
-
18
-
19
-
20
-
21
-
22
-
23
-
24
-
25
-
26
-
27
-
28
-
29
-
30
-
31
-
32
-
33
-
34
-
35
-
36
-
37
-
38
-
39
-
40
-
41
-
42
-
43
-
44
-
45
-
46
-
47
-
48
-
49
-
50
-
51
-
52
-
53
-
54
-
55
-
56
-
57
-
58
-
59
-
60
-
61
-
62
-
63
-
64
-
65
-
66
-
67
-
68
-
69
-
70
-
71
-
72
-
73
-
74
-
75
-
76
-
77
-
78
-
79
-
80
-
81
-
82
-
83
-
84
-
85
-
86
-
87
-
88
-
89
-
90
-
91
-
92
-
93
-
94
-
 95
95 -
 96
96 -
 97
97 -
 98
98 -
 99
99 -
 100
100 -
 101
101 -
 102
102 -
 103
103 -
 104
104 -
 105
105 -
 106
106 -
 107
107 -
 108
108 -
 109
109 -
 110
110 -
 111
111 -
 112
112 -
 113
113 -
 114
114 -
 115
115 -
116
-
117
-
118
-
119
-
120
-
121
-
122
-
123
-
124
-
125
-
126
-
127
-
128
-
129
-
130
-
131
-
132
-
133
-
134
-
135
-
136
-
137
-
138
-
139
-
140
-
141
-
142
-
143
-
144
-
145
-
146
-
147
-
148
-
149
-
150
-
151
-
152
-
153
-
154
-
155
-
156
-
157
-
158
-
159
-
160
-
161
-
162
-
163
-
164
-
165
-
166
-
167
-
168
-
169
-
170
-
171
-
172
-
173
-
174
-
175
-
176
-
177
-
178
-
179
-
180
-
181
-
182
-
183
-
184
-
185
-
186
-
187
-
188
-
189
-
190
-
191
-
192
-
193
-
194
-
195
-
196
-
197
-
198
-
199
-
200
-
201
-
202
-
203
-
204
-
205
-
206
-
207
-
208
-
209
-
210
-
211
-
212
-
213
-
214
-
215
-
216
-
217
-
218
-
219
-
220
-
221
-
222
-
223
-
224
-
225
-
226
-
227
-
228
-
229
-
230
-
231
-
232
-
233
-
234
-
235
-
236
-
237
-
238
-
239
-
240
-
241
-
242
-
243
-
244
-
245
-
246
-
247
-
248
-
249
-
250
-
251
-
252
-
253
-
254
-
255
-
256
-
257
 |
 |
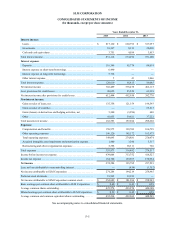
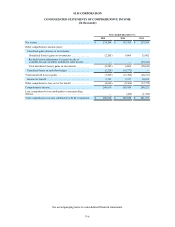
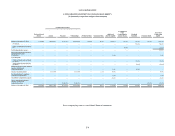
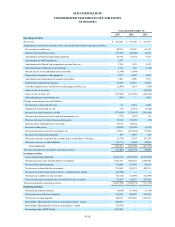
SLM CORPORATION
NOTES TO CONSOLIDATED FINANCIAL STATEMENTS (Continued)
(Dollars in thousands, unless otherwise noted)
2. Significant Accounting Policies (Continued)
F-15
We analyze our portfolios to determine the effects that the various stages of delinquency and forbearance have on
borrower default behavior and ultimate charge off. We estimate the allowance for loan losses for our loan portfolios using a roll
rate analysis of delinquent and current accounts. A “roll rate analysis” is a technique used to estimate the likelihood that a loan
receivable may progress through the various delinquency stages and ultimately charge off. We also take into account the current
and future economic environment and certain other qualitative factors when calculating the allowance for loan losses.
The evaluation of the allowance for loan losses is inherently subjective, as it requires material estimates that may be
susceptible to significant changes. Our default estimates are based on a loss emergence period of one year for Private Education
Loans and two years for FFELP Loans. A loss emergence period represents the expected period between the first occurrence of
an event likely to cause a loss on a loan and the date the loan is expected to be charged off, taking into consideration account
management practices that affect the timing of a loss, such as the usage of forbearance. The loss emergence period underlying
the allowance for loan losses is subject to a number of assumptions. If actual future performance in delinquency, charge-offs
and recoveries are significantly different than estimated, or account management assumptions or practices were to change, this
could materially affect the estimate of the allowance for loan losses, the timing of when losses are recognized, and the related
provision for credit losses on our consolidated statements of income.
We utilize various models to determine an appropriate allowance for loan losses. Changes to model inputs are made as
deemed necessary. These models are reviewed and validated periodically.
Below we describe in further detail our policies and procedures for the allowance for loan losses as they relate to our
Private Education Loan and FFELP Loan portfolios.
Allowance for Private Education Loan Losses
We maintain an allowance for loan losses at an amount sufficient to absorb probable losses incurred in our portfolios at
the reporting date based on a projection of estimated probable credit losses incurred in the portfolio.
In determining the allowance for loan losses on our Private Education Loans that are not troubled debt restructurings
(“TDRs”), we estimate the principal amount of loans that will default over the next year (one year being the expected period
between a loss event and default) and how much we expect to recover over the same one year period related to the defaulted
amount. The expected defaults less our expected recoveries adjusted for any qualitative factors (discussed below) equal the
allowance related to this portfolio. Our historical experience indicates that, on average, the time between the date that a
customer experiences a default causing event (i.e., the loss trigger event) and the date that we charge off the unrecoverable
portion of that loan is one year.
In estimating both the non-TDR and TDR allowance amounts, we start with historical experience of customer
delinquency and default behavior. We make judgments about which historical period to start with and then make further
judgments about whether that historical experience is representative of future expectations and whether additional adjustments
may be needed to those historical default rates. We may also take certain other qualitative factors into consideration when
calculating the allowance for loan losses. These qualitative factors include, but are not limited to, changes in the economic
environment, changes in lending policies and procedures, including changes in underwriting standards and collection, charge-
off and recovery practices not already included in the analysis, and the effect of other external factors such as legal and
regulatory requirements on the level of estimated credit losses.
Our non-TDR allowance for loan losses is estimated using an analysis of delinquent and current accounts. Our model is
used to estimate the likelihood that a loan receivable may progress through the various delinquency stages and ultimately
charge off. Once a charge-off forecast is estimated, a recovery assumption is layered on top. In estimating recoveries, we use
both estimates of what we would receive from the sale of delinquent loans as well as historical borrower payment behavior to
estimate the timing and amount of future recoveries on charged-off loans.