Sallie Mae 2015 Annual Report Download - page 159
Download and view the complete annual report
Please find page 159 of the 2015 Sallie Mae annual report below. You can navigate through the pages in the report by either clicking on the pages listed below, or by using the keyword search tool below to find specific information within the annual report.-
 1
1 -
2
-
3
-
4
-
5
-
6
-
7
-
8
-
9
-
10
-
11
-
12
-
13
-
14
-
15
-
16
-
17
-
18
-
19
-
20
-
21
-
22
-
23
-
24
-
25
-
26
-
27
-
28
-
29
-
30
-
31
-
32
-
33
-
34
-
35
-
36
-
37
-
38
-
39
-
40
-
41
-
42
-
43
-
44
-
45
-
46
-
47
-
48
-
49
-
50
-
51
-
52
-
53
-
54
-
55
-
56
-
57
-
58
-
59
-
60
-
61
-
62
-
63
-
64
-
65
-
66
-
67
-
68
-
69
-
70
-
71
-
72
-
73
-
74
-
75
-
76
-
77
-
78
-
79
-
80
-
81
-
82
-
83
-
84
-
85
-
86
-
87
-
88
-
89
-
90
-
91
-
92
-
93
-
94
-
95
-
96
-
97
-
98
-
99
-
100
-
101
-
102
-
103
-
104
-
105
-
106
-
107
-
108
-
109
-
110
-
111
-
112
-
113
-
114
-
115
-
116
-
117
-
118
-
119
-
120
-
121
-
122
-
123
-
124
-
125
-
126
-
127
-
128
-
129
-
130
-
131
-
132
-
133
-
134
-
135
-
136
-
137
-
138
-
139
-
140
-
141
-
142
-
143
-
144
-
145
-
146
-
147
-
148
-
 149
149 -
 150
150 -
 151
151 -
 152
152 -
 153
153 -
 154
154 -
 155
155 -
 156
156 -
 157
157 -
 158
158 -
 159
159 -
 160
160 -
 161
161 -
 162
162 -
 163
163 -
 164
164 -
 165
165 -
 166
166 -
 167
167 -
 168
168 -
 169
169 -
170
-
171
-
172
-
173
-
174
-
175
-
176
-
177
-
178
-
179
-
180
-
181
-
182
-
183
-
184
-
185
-
186
-
187
-
188
-
189
-
190
-
191
-
192
-
193
-
194
-
195
-
196
-
197
-
198
-
199
-
200
-
201
-
202
-
203
-
204
-
205
-
206
-
207
-
208
-
209
-
210
-
211
-
212
-
213
-
214
-
215
-
216
-
217
-
218
-
219
-
220
-
221
-
222
-
223
-
224
-
225
-
226
-
227
-
228
-
229
-
230
-
231
-
232
-
233
-
234
-
235
-
236
-
237
-
238
-
239
-
240
-
241
-
242
-
243
-
244
-
245
-
246
-
247
-
248
-
249
-
250
-
251
-
252
-
253
-
254
-
255
-
256
-
257
 |
 |
SLM CORPORATION
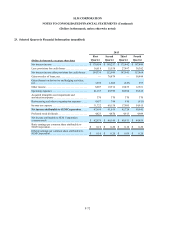
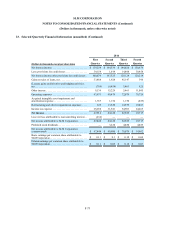
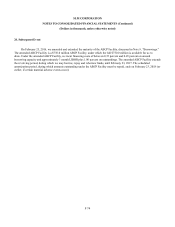
NOTES TO CONSOLIDATED FINANCIAL STATEMENTS (Continued)
(Dollars in thousands, unless otherwise noted)
F-69
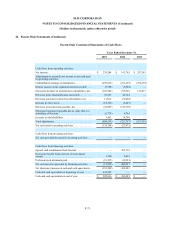
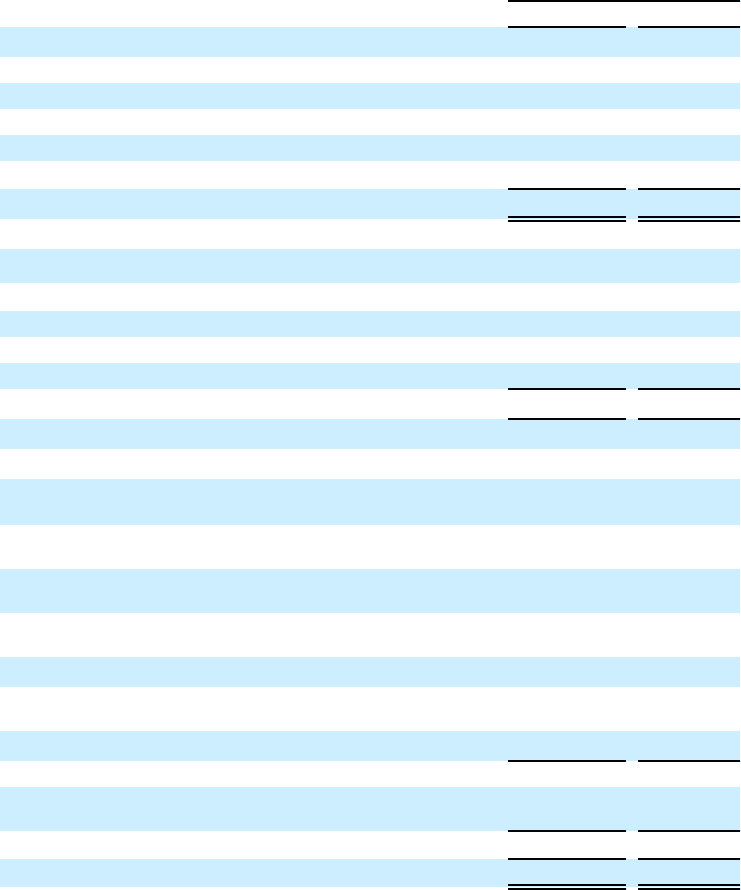
22. Parent Only Statements
The following parent company-only financial information should be read in conjunction with the other notes to the
consolidated financial statements. The accounting policies for the parent company-only financial statements are the same as
those used in the presentation of the consolidated financial statements other than the parent company-only financial statements
account for the parent company's investments in its subsidiaries under the equity method.
Parent Only Condensed Balance Sheets
December 31,
2015 2014
Assets
Cash and cash equivalents. . . . . . . . . . . . . . . . . . . . . . . . . . . . . . . . . . . . $ 282,036 $ 434,245
Total investments in subsidiaries (primarily Sallie Mae Bank) . . . . . . . 1,810,567 1,389,995
Tax indemnification receivable. . . . . . . . . . . . . . . . . . . . . . . . . . . . . . . . 186,076 240,311
Due from subsidiaries, net. . . . . . . . . . . . . . . . . . . . . . . . . . . . . . . . . . . . 21,396 32,408
Other assets . . . . . . . . . . . . . . . . . . . . . . . . . . . . . . . . . . . . . . . . . . . . . . . 1,352 1,943
Total assets . . . . . . . . . . . . . . . . . . . . . . . . . . . . . . . . . . . . . . . . . . . . . . . $ 2,301,427 $ 2,098,902
Liabilities and Equity
Liabilities
Income taxes payable, net . . . . . . . . . . . . . . . . . . . . . . . . . . . . . . . . . . . . $ 189,215 $ 245,782
Payable due to Navient . . . . . . . . . . . . . . . . . . . . . . . . . . . . . . . . . . . . . . 1,990 8,764
Other liabilities . . . . . . . . . . . . . . . . . . . . . . . . . . . . . . . . . . . . . . . . . . . . 13,899 14,398
Total liabilities. . . . . . . . . . . . . . . . . . . . . . . . . . . . . . . . . . . . . . . . . . . . . $ 205,104 268,944
Equity
Preferred stock, par value $0.20 per share, 20 million shares
authorized:
Series A: 3.3 million and 3.3 million shares issued, respectively, at
stated value of $50 . . . . . . . . . . . . . . . . . . . . . . . . . . . . . . . . . . . . . . . . 165,000 165,000
Series B: 4 million and 4 million shares issued, respectively, at
stated value of $100 per share . . . . . . . . . . . . . . . . . . . . . . . . . . . . . . . 400,000 400,000
Common stock, par value $0.20 per share, 1.125 billion shares
authorized: 430.7 million and 424.8 million shares issued, respectively 86,136 84,961
Additional paid-in capital . . . . . . . . . . . . . . . . . . . . . . . . . . . . . . . . . . . . 1,135,860 1,090,511
Accumulated other comprehensive loss (net of tax benefit of $9,949
and $7,186, respectively . . . . . . . . . . . . . . . . . . . . . . . . . . . . . . . . . . . . . (16,059) (11,393)
Retained earnings . . . . . . . . . . . . . . . . . . . . . . . . . . . . . . . . . . . . . . . . . . 366,609 113,066
Total SLM Corporation stockholders' equity before treasury stock . . . . 2,137,546 1,842,145
Less: common stock held in treasury at cost: 4.4 million and 1.4
million shares, respectively. . . . . . . . . . . . . . . . . . . . . . . . . . . . . . . . . . . (41,223) (12,187)
Total equity . . . . . . . . . . . . . . . . . . . . . . . . . . . . . . . . . . . . . . . . . . . . . . . 2,096,323 1,829,958
Total liabilities and equity. . . . . . . . . . . . . . . . . . . . . . . . . . . . . . . . . . . . $ 2,301,427 $ 2,098,902