Sallie Mae 2015 Annual Report Download - page 136
Download and view the complete annual report
Please find page 136 of the 2015 Sallie Mae annual report below. You can navigate through the pages in the report by either clicking on the pages listed below, or by using the keyword search tool below to find specific information within the annual report.-
 1
1 -
2
-
3
-
4
-
5
-
6
-
7
-
8
-
9
-
10
-
11
-
12
-
13
-
14
-
15
-
16
-
17
-
18
-
19
-
20
-
21
-
22
-
23
-
24
-
25
-
26
-
27
-
28
-
29
-
30
-
31
-
32
-
33
-
34
-
35
-
36
-
37
-
38
-
39
-
40
-
41
-
42
-
43
-
44
-
45
-
46
-
47
-
48
-
49
-
50
-
51
-
52
-
53
-
54
-
55
-
56
-
57
-
58
-
59
-
60
-
61
-
62
-
63
-
64
-
65
-
66
-
67
-
68
-
69
-
70
-
71
-
72
-
73
-
74
-
75
-
76
-
77
-
78
-
79
-
80
-
81
-
82
-
83
-
84
-
85
-
86
-
87
-
88
-
89
-
90
-
91
-
92
-
93
-
94
-
95
-
96
-
97
-
98
-
99
-
100
-
101
-
102
-
103
-
104
-
105
-
106
-
107
-
108
-
109
-
110
-
111
-
112
-
113
-
114
-
115
-
116
-
117
-
118
-
119
-
120
-
121
-
122
-
123
-
124
-
125
-
 126
126 -
 127
127 -
 128
128 -
 129
129 -
 130
130 -
 131
131 -
 132
132 -
 133
133 -
 134
134 -
 135
135 -
 136
136 -
 137
137 -
 138
138 -
 139
139 -
 140
140 -
 141
141 -
 142
142 -
 143
143 -
 144
144 -
 145
145 -
 146
146 -
147
-
148
-
149
-
150
-
151
-
152
-
153
-
154
-
155
-
156
-
157
-
158
-
159
-
160
-
161
-
162
-
163
-
164
-
165
-
166
-
167
-
168
-
169
-
170
-
171
-
172
-
173
-
174
-
175
-
176
-
177
-
178
-
179
-
180
-
181
-
182
-
183
-
184
-
185
-
186
-
187
-
188
-
189
-
190
-
191
-
192
-
193
-
194
-
195
-
196
-
197
-
198
-
199
-
200
-
201
-
202
-
203
-
204
-
205
-
206
-
207
-
208
-
209
-
210
-
211
-
212
-
213
-
214
-
215
-
216
-
217
-
218
-
219
-
220
-
221
-
222
-
223
-
224
-
225
-
226
-
227
-
228
-
229
-
230
-
231
-
232
-
233
-
234
-
235
-
236
-
237
-
238
-
239
-
240
-
241
-
242
-
243
-
244
-
245
-
246
-
247
-
248
-
249
-
250
-
251
-
252
-
253
-
254
-
255
-
256
-
257
 |
 |

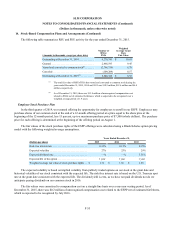
SLM CORPORATION
NOTES TO CONSOLIDATED FINANCIAL STATEMENTS (Continued)
(Dollars in thousands, unless otherwise noted)
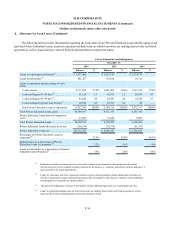
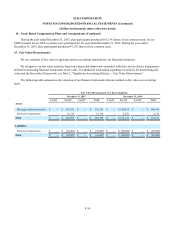
11. Derivative Financial Instruments (Continued)
F-46
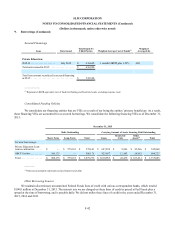
Cash Flow Fair Value Trading Total
December
31, December
31, December
31, December
31, December
31, December
31, December
31, December
31,
2015 2014 2015 2014 2015 2014 2015 2014
Notional Values
Interest rate
swaps . . . . . . . . $ 1,109,933 $ 1,106,920 $ 3,080,167 $ 3,044,492 $ 1,305,757 $ 973,539 $ 5,495,857 $ 5,124,951
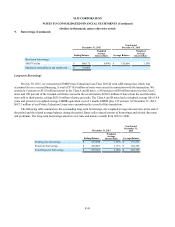
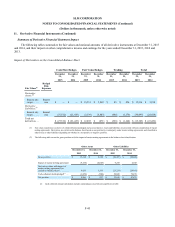
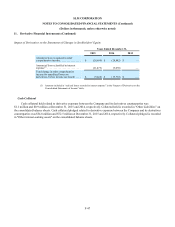
Impact of Derivatives on the Consolidated Statements of Income
Years Ended December 31,
2015 2014 2013
Fair Value Hedges
Interest rate swaps:
Hedge ineffectiveness gains
(losses) recorded in earnings . . $ 2,695 $ 1,718 $ (558)
Realized gains recorded in
interest expense . . . . . . . . . . . . 29,940 20,958 28,668
Total . . . . . . . . . . . . . . . . . . . . . $ 32,635 $ 22,676 $ 28,110
Cash Flow Hedges
Interest rate swaps:
Hedge ineffectiveness losses
recorded in earnings. . . . . . . . . $ (1,427) $ (520) $ —
Realized losses recorded in
interest expense . . . . . . . . . . . . (21,475) (9,070) —
Total . . . . . . . . . . . . . . . . . . . . . $ (22,902) $ (9,590) $ —
Trading
Interest rate swaps:
Interest reclassification. . . . . . . $ 3,451 $ (2,250) $ 1,285
Change in fair value of future
interest payments recorded in
earnings . . . . . . . . . . . . . . . . . . 581 (2,944) (87)
Total(1)
. . . . . . . . . . . . . . . . . . . . 4,032 (5,194) 1,198
Total . . . . . . . . . . . . . . . . . . . . . . $ 13,765 $ 7,892 $ 29,308
(1) Amounts included in "gains (losses) on derivatives and hedging activities, net."