Sallie Mae 2015 Annual Report Download - page 66
Download and view the complete annual report
Please find page 66 of the 2015 Sallie Mae annual report below. You can navigate through the pages in the report by either clicking on the pages listed below, or by using the keyword search tool below to find specific information within the annual report.-
 1
1 -
2
-
3
-
4
-
5
-
6
-
7
-
8
-
9
-
10
-
11
-
12
-
13
-
14
-
15
-
16
-
17
-
18
-
19
-
20
-
21
-
22
-
23
-
24
-
25
-
26
-
27
-
28
-
29
-
30
-
31
-
32
-
33
-
34
-
35
-
36
-
37
-
38
-
39
-
40
-
41
-
42
-
43
-
44
-
45
-
46
-
47
-
48
-
49
-
50
-
51
-
52
-
53
-
54
-
55
-
 56
56 -
 57
57 -
 58
58 -
 59
59 -
 60
60 -
 61
61 -
 62
62 -
 63
63 -
 64
64 -
 65
65 -
 66
66 -
 67
67 -
 68
68 -
 69
69 -
 70
70 -
 71
71 -
 72
72 -
 73
73 -
 74
74 -
 75
75 -
 76
76 -
77
-
78
-
79
-
80
-
81
-
82
-
83
-
84
-
85
-
86
-
87
-
88
-
89
-
90
-
91
-
92
-
93
-
94
-
95
-
96
-
97
-
98
-
99
-
100
-
101
-
102
-
103
-
104
-
105
-
106
-
107
-
108
-
109
-
110
-
111
-
112
-
113
-
114
-
115
-
116
-
117
-
118
-
119
-
120
-
121
-
122
-
123
-
124
-
125
-
126
-
127
-
128
-
129
-
130
-
131
-
132
-
133
-
134
-
135
-
136
-
137
-
138
-
139
-
140
-
141
-
142
-
143
-
144
-
145
-
146
-
147
-
148
-
149
-
150
-
151
-
152
-
153
-
154
-
155
-
156
-
157
-
158
-
159
-
160
-
161
-
162
-
163
-
164
-
165
-
166
-
167
-
168
-
169
-
170
-
171
-
172
-
173
-
174
-
175
-
176
-
177
-
178
-
179
-
180
-
181
-
182
-
183
-
184
-
185
-
186
-
187
-
188
-
189
-
190
-
191
-
192
-
193
-
194
-
195
-
196
-
197
-
198
-
199
-
200
-
201
-
202
-
203
-
204
-
205
-
206
-
207
-
208
-
209
-
210
-
211
-
212
-
213
-
214
-
215
-
216
-
217
-
218
-
219
-
220
-
221
-
222
-
223
-
224
-
225
-
226
-
227
-
228
-
229
-
230
-
231
-
232
-
233
-
234
-
235
-
236
-
237
-
238
-
239
-
240
-
241
-
242
-
243
-
244
-
245
-
246
-
247
-
248
-
249
-
250
-
251
-
252
-
253
-
254
-
255
-
256
-
257
 |
 |
64
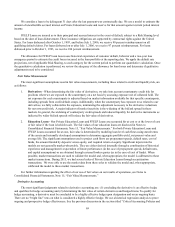
Counterparty Exposure
Counterparty exposure related to financial instruments arises from the risk that a lending, investment or derivative
counterparty will not be able to meet its obligations to us.
Excess cash is generally invested with the Federal Reserve on an overnight basis or in the Federal Reserve’s Term
Deposit Facility, minimizing counterparty exposure on cash balances.
Our investment portfolio includes a small portfolio of mortgage-backed securities issued by government agencies and
government-sponsored enterprises that are purchased to meet Community Reinvestment Act targets. Additionally, our investing
activity is governed by Board-approved limits on the amount that is allowed to be invested with any one issuer based on the
credit rating of the issuer, further minimizing our counterparty exposure. Counterparty credit risk is considered when valuing
investments and considering impairment.
Related to derivative transactions, protection against counterparty risk is generally provided by International Swaps and
Derivatives Association, Inc. (“ISDA”) Credit Support Annexes (“CSAs”), or clearinghouses for Over the Counter derivatives.
CSAs require a counterparty to post collateral if a potential default would expose the other party to a loss. All derivative
contracts entered into by the Bank are covered under such agreements and require collateral to be exchanged based on the net
fair value of derivatives with each counterparty. Our exposure is limited to the value of the derivative contracts in a gain
position less any collateral posted by the counterparty.
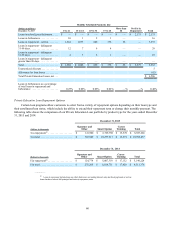
Title VII of the Dodd-Frank Act requires all standardized derivatives, including most interest rate swaps, to be submitted
for clearing to central intermediaries to reduce counterparty risk. As of December 31, 2015, $4.9 billion notional of our
derivative contracts were cleared on the Chicago Mercantile Exchange and the London Clearing House. This represents
88 percent of our total notional derivative contracts of $5.5 billion. All derivative contracts cleared through an exchange require
collateral to be exchanged based on the fair value of the derivative. Our exposure is limited to the value of the derivative
contracts in a gain position less any collateral posted by the counterparty.
We have liquidity exposure related to collateral movements between us and our derivative counterparties. Movements in
the value of the derivatives, which are primarily affected by changes in interest rates, may require us to return cash collateral
held or may require us to access primary liquidity to post collateral to counterparties.
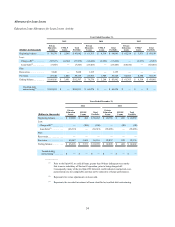
The table below highlights exposure related to our derivative counterparties as of December 31, 2015.
(Dollars in thousands)
SLM Corporation
and Sallie Mae Bank
Contracts
Exposure, net of collateral . . . . . . . . . . . . . . . . . . . . . . . . . . . . $ 50,069
Percent of exposure to counterparties with credit ratings
below S&P AA- or Moody’s Aa3. . . . . . . . . . . . . . . . . . . . . . . 38.44%
Percent of exposure to counterparties with credit ratings
below S&P A- or Moody’s Baa. . . . . . . . . . . . . . . . . . . . . . . . . 0.07%