Sallie Mae 2015 Annual Report Download - page 53
Download and view the complete annual report
Please find page 53 of the 2015 Sallie Mae annual report below. You can navigate through the pages in the report by either clicking on the pages listed below, or by using the keyword search tool below to find specific information within the annual report.-
 1
1 -
2
-
3
-
4
-
5
-
6
-
7
-
8
-
9
-
10
-
11
-
12
-
13
-
14
-
15
-
16
-
17
-
18
-
19
-
20
-
21
-
22
-
23
-
24
-
25
-
26
-
27
-
28
-
29
-
30
-
31
-
32
-
33
-
34
-
35
-
36
-
37
-
38
-
39
-
40
-
41
-
42
-
 43
43 -
 44
44 -
 45
45 -
 46
46 -
 47
47 -
 48
48 -
 49
49 -
 50
50 -
 51
51 -
 52
52 -
 53
53 -
 54
54 -
 55
55 -
 56
56 -
 57
57 -
 58
58 -
 59
59 -
 60
60 -
 61
61 -
 62
62 -
 63
63 -
64
-
65
-
66
-
67
-
68
-
69
-
70
-
71
-
72
-
73
-
74
-
75
-
76
-
77
-
78
-
79
-
80
-
81
-
82
-
83
-
84
-
85
-
86
-
87
-
88
-
89
-
90
-
91
-
92
-
93
-
94
-
95
-
96
-
97
-
98
-
99
-
100
-
101
-
102
-
103
-
104
-
105
-
106
-
107
-
108
-
109
-
110
-
111
-
112
-
113
-
114
-
115
-
116
-
117
-
118
-
119
-
120
-
121
-
122
-
123
-
124
-
125
-
126
-
127
-
128
-
129
-
130
-
131
-
132
-
133
-
134
-
135
-
136
-
137
-
138
-
139
-
140
-
141
-
142
-
143
-
144
-
145
-
146
-
147
-
148
-
149
-
150
-
151
-
152
-
153
-
154
-
155
-
156
-
157
-
158
-
159
-
160
-
161
-
162
-
163
-
164
-
165
-
166
-
167
-
168
-
169
-
170
-
171
-
172
-
173
-
174
-
175
-
176
-
177
-
178
-
179
-
180
-
181
-
182
-
183
-
184
-
185
-
186
-
187
-
188
-
189
-
190
-
191
-
192
-
193
-
194
-
195
-
196
-
197
-
198
-
199
-
200
-
201
-
202
-
203
-
204
-
205
-
206
-
207
-
208
-
209
-
210
-
211
-
212
-
213
-
214
-
215
-
216
-
217
-
218
-
219
-
220
-
221
-
222
-
223
-
224
-
225
-
226
-
227
-
228
-
229
-
230
-
231
-
232
-
233
-
234
-
235
-
236
-
237
-
238
-
239
-
240
-
241
-
242
-
243
-
244
-
245
-
246
-
247
-
248
-
249
-
250
-
251
-
252
-
253
-
254
-
255
-
256
-
257
 |
 |

51
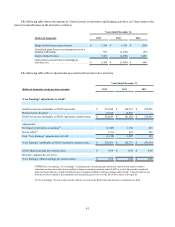
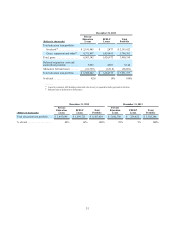
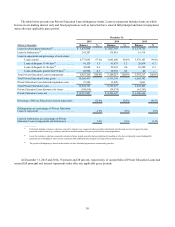
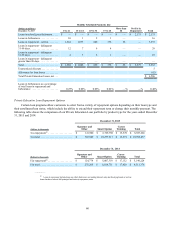
December 31, 2013
(Dollars in thousands)
Private
Education
Loans FFELP
Loans Total
Portfolio
Total education loan portfolio:
In-school(1) . . . . . . . . . . . . . . . $ 2,191,445 $ 2,477 $ 2,193,922
Grace, repayment and other(2) .4,371,897 1,424,495 5,796,392
Total, gross. . . . . . . . . . . . . . . . . . 6,563,342 1,426,972 7,990,314
Deferred origination costs and
unamortized premium . . . . . . . . . 5,063 4,081 9,144
Allowance for loan losses . . . . . . (61,763) (6,318) (68,081)
Total education loan portfolio . . . $ 6,506,642 $ 1,424,735 $ 7,931,377
% of total . . . . . . . . . . . . . . . . . . . 82% 18% 100%
_________
(1) Loans for customers still attending school and who are not yet required to make payments on the loan.
(2) Includes loans in deferment or forbearance.
December 31, 2012 December 31, 2011
(Dollars in thousands)
Private
Education
Loans FFELP
Loans Total
Portfolio
Private
Education
Loans FFELP
Loans Total
Portfolio
Total education loan portfolio . . . $ 5,447,699 $ 1,039,755 $ 6,487,454 $ 5,062,788 $ 239,452 $ 5,302,240
% of total . . . . . . . . . . . . . . . . . . . 84% 16% 100% 95% 5% 100%