Sallie Mae 2015 Annual Report Download - page 100
Download and view the complete annual report
Please find page 100 of the 2015 Sallie Mae annual report below. You can navigate through the pages in the report by either clicking on the pages listed below, or by using the keyword search tool below to find specific information within the annual report.-
 1
1 -
2
-
3
-
4
-
5
-
6
-
7
-
8
-
9
-
10
-
11
-
12
-
13
-
14
-
15
-
16
-
17
-
18
-
19
-
20
-
21
-
22
-
23
-
24
-
25
-
26
-
27
-
28
-
29
-
30
-
31
-
32
-
33
-
34
-
35
-
36
-
37
-
38
-
39
-
40
-
41
-
42
-
43
-
44
-
45
-
46
-
47
-
48
-
49
-
50
-
51
-
52
-
53
-
54
-
55
-
56
-
57
-
58
-
59
-
60
-
61
-
62
-
63
-
64
-
65
-
66
-
67
-
68
-
69
-
70
-
71
-
72
-
73
-
74
-
75
-
76
-
77
-
78
-
79
-
80
-
81
-
82
-
83
-
84
-
85
-
86
-
87
-
88
-
89
-
 90
90 -
 91
91 -
 92
92 -
 93
93 -
 94
94 -
 95
95 -
 96
96 -
 97
97 -
 98
98 -
 99
99 -
 100
100 -
 101
101 -
 102
102 -
 103
103 -
 104
104 -
 105
105 -
 106
106 -
 107
107 -
 108
108 -
 109
109 -
 110
110 -
111
-
112
-
113
-
114
-
115
-
116
-
117
-
118
-
119
-
120
-
121
-
122
-
123
-
124
-
125
-
126
-
127
-
128
-
129
-
130
-
131
-
132
-
133
-
134
-
135
-
136
-
137
-
138
-
139
-
140
-
141
-
142
-
143
-
144
-
145
-
146
-
147
-
148
-
149
-
150
-
151
-
152
-
153
-
154
-
155
-
156
-
157
-
158
-
159
-
160
-
161
-
162
-
163
-
164
-
165
-
166
-
167
-
168
-
169
-
170
-
171
-
172
-
173
-
174
-
175
-
176
-
177
-
178
-
179
-
180
-
181
-
182
-
183
-
184
-
185
-
186
-
187
-
188
-
189
-
190
-
191
-
192
-
193
-
194
-
195
-
196
-
197
-
198
-
199
-
200
-
201
-
202
-
203
-
204
-
205
-
206
-
207
-
208
-
209
-
210
-
211
-
212
-
213
-
214
-
215
-
216
-
217
-
218
-
219
-
220
-
221
-
222
-
223
-
224
-
225
-
226
-
227
-
228
-
229
-
230
-
231
-
232
-
233
-
234
-
235
-
236
-
237
-
238
-
239
-
240
-
241
-
242
-
243
-
244
-
245
-
246
-
247
-
248
-
249
-
250
-
251
-
252
-
253
-
254
-
255
-
256
-
257
 |
 |

F-10
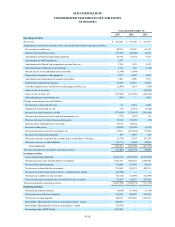
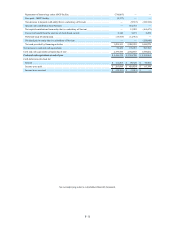
SLM CORPORATION
CONSOLIDATED STATEMENTS OF CASH FLOWS
(In thousands)
Years Ended December 31,
2015 2014 2013
Operating activities
Net income . . . . . . . . . . . . . . . . . . . . . . . . . . . . . . . . . . . . . . . . . . . . . . . . . . . . . . . . . . . . . . . . . $ 274,284 $ 193,785 $ 257,593
Adjustments to reconcile net income to net cash (used in) provided by operating activities:
Provisions for credit losses. . . . . . . . . . . . . . . . . . . . . . . . . . . . . . . . . . . . . . . . . . . . . . . . . . . . 90,055 85,529 69,339
Deferred tax (benefit) provision. . . . . . . . . . . . . . . . . . . . . . . . . . . . . . . . . . . . . . . . . . . . . . . . (77,227) (40,888) 14,567
Amortization of brokered deposit placement fee . . . . . . . . . . . . . . . . . . . . . . . . . . . . . . . . . . . 10,510 10,164 9,754
Amortization of ABCP upfront fee. . . . . . . . . . . . . . . . . . . . . . . . . . . . . . . . . . . . . . . . . . . . . . 2,337 — —
Amortization of deferred loan origination costs and fees, net . . . . . . . . . . . . . . . . . . . . . . . . . 3,746 1,995 2,199
Net amortization of discount on investments. . . . . . . . . . . . . . . . . . . . . . . . . . . . . . . . . . . . . . 1,716 633 (7,187)
Interest income on tax indemnification receivable. . . . . . . . . . . . . . . . . . . . . . . . . . . . . . . . . . (5,398) (5,904) —
Depreciation of premises and equipment. . . . . . . . . . . . . . . . . . . . . . . . . . . . . . . . . . . . . . . . . 7,437 6,099 5,059
Amortization and impairment of acquired intangibles. . . . . . . . . . . . . . . . . . . . . . . . . . . . . . . 1,480 3,290 3,317
Stock-based compensation expense . . . . . . . . . . . . . . . . . . . . . . . . . . . . . . . . . . . . . . . . . . . . . 21,598 24,971 15,681
Unrealized (gains)/losses on derivative and hedging activities, net. . . . . . . . . . . . . . . . . . . . . (2,500) 1,214 (324)
Gains on sale of securities . . . . . . . . . . . . . . . . . . . . . . . . . . . . . . . . . . . . . . . . . . . . . . . . . . . . — — (63,813)
Gains on sale of loans, net . . . . . . . . . . . . . . . . . . . . . . . . . . . . . . . . . . . . . . . . . . . . . . . . . . . . (135,358) (121,359) (196,593)
Other adjustments to net income, net. . . . . . . . . . . . . . . . . . . . . . . . . . . . . . . . . . . . . . . . . . . . (306) — 1,046
Changes in operating assets and liabilities:
Net decrease in loans held for sale. . . . . . . . . . . . . . . . . . . . . . . . . . . . . . . . . . . . . . . . . . . . . . 55 6,519 3,628
Origination of loans held for sale. . . . . . . . . . . . . . . . . . . . . . . . . . . . . . . . . . . . . . . . . . . . . . . (55) (6,519) (3,628)
Increase in accrued interest receivable. . . . . . . . . . . . . . . . . . . . . . . . . . . . . . . . . . . . . . . . . . . (377,648) (331,014) (281,856)
(Increase) decrease in restricted cash and investments, net . . . . . . . . . . . . . . . . . . . . . . . . . . . (737) (493) 136
Decrease (increase) in other interest-earning assets. . . . . . . . . . . . . . . . . . . . . . . . . . . . . . . . . 17,634 (72,435) (39)
Decrease in tax indemnification receivable . . . . . . . . . . . . . . . . . . . . . . . . . . . . . . . . . . . . . . . 59,633 44,724 —
Increase in other assets. . . . . . . . . . . . . . . . . . . . . . . . . . . . . . . . . . . . . . . . . . . . . . . . . . . . . . . (18,070) (24,959) (2,357)
Increase (decrease) in income tax payable, net . . . . . . . . . . . . . . . . . . . . . . . . . . . . . . . . . . . . 56,813 (221,222) 56,784
Increase in accrued interest payable. . . . . . . . . . . . . . . . . . . . . . . . . . . . . . . . . . . . . . . . . . . . . 303 2,985 239
(Decrease) increase in payable due to entity that is a subsidiary of Navient. . . . . . . . . . . . . . (6,774) 8,764 147,379
(Decrease) increase in other liabilities . . . . . . . . . . . . . . . . . . . . . . . . . . . . . . . . . . . . . . . . . . . (14,731) (2,652) 39,096
Total adjustments . . . . . . . . . . . . . . . . . . . . . . . . . . . . . . . . . . . . . . . . . . . . . . . . . . . . . . . . (365,487) (630,558) (187,573)
Total net cash (used in) provided by operating activities . . . . . . . . . . . . . . . . . . . . . . . . . . . . . . (91,203) (436,773) 70,020
Investing activities
Loans acquired and originated . . . . . . . . . . . . . . . . . . . . . . . . . . . . . . . . . . . . . . . . . . . . . . . . . (4,366,651) (4,094,790) (4,387,093)
Net proceeds from sales of loans held for investment . . . . . . . . . . . . . . . . . . . . . . . . . . . . . . . 1,547,373 2,001,625 2,546,940
Proceeds from claim payments. . . . . . . . . . . . . . . . . . . . . . . . . . . . . . . . . . . . . . . . . . . . . . . . . 111,580 127,869 82,615
Net decrease in loans held for investment . . . . . . . . . . . . . . . . . . . . . . . . . . . . . . . . . . . . . . . . 913,005 638,321 490,791
Increase in restricted cash and investment - variable interest entities . . . . . . . . . . . . . . . . . . . (22,439) — —
Purchases of available-for-sale securities. . . . . . . . . . . . . . . . . . . . . . . . . . . . . . . . . . . . . . . . . (64,112) (72,049) (62,097)
Proceeds from sales and maturities of available-for-sale securities. . . . . . . . . . . . . . . . . . . . . 33,735 10,653 597,728
Total net cash used in investing activities. . . . . . . . . . . . . . . . . . . . . . . . . . . . . . . . . . . . . . . . . . (1,847,509) (1,388,371) (731,116)
Financing activities
Brokered deposit placement fee . . . . . . . . . . . . . . . . . . . . . . . . . . . . . . . . . . . . . . . . . . . . . . . . (4,098) (15,098) (12,114)
Net increase in certificates of deposit. . . . . . . . . . . . . . . . . . . . . . . . . . . . . . . . . . . . . . . . . . . . 611,643 340,225 535,456
Net increase in other deposits. . . . . . . . . . . . . . . . . . . . . . . . . . . . . . . . . . . . . . . . . . . . . . . . . . 324,518 1,207,487 1,126,673
Borrowings collateralized by loans in securitization trusts - issued . . . . . . . . . . . . . . . . . . . . 620,681 — —
Borrowings collateralized by loans in securitization - repaid . . . . . . . . . . . . . . . . . . . . . . . . . (41,976) — —
Borrowings under ABCP facility . . . . . . . . . . . . . . . . . . . . . . . . . . . . . . . . . . . . . . . . . . . . . . . 1,210,180 — —