Sallie Mae 2015 Annual Report Download - page 57
Download and view the complete annual report
Please find page 57 of the 2015 Sallie Mae annual report below. You can navigate through the pages in the report by either clicking on the pages listed below, or by using the keyword search tool below to find specific information within the annual report.-
 1
1 -
2
-
3
-
4
-
5
-
6
-
7
-
8
-
9
-
10
-
11
-
12
-
13
-
14
-
15
-
16
-
17
-
18
-
19
-
20
-
21
-
22
-
23
-
24
-
25
-
26
-
27
-
28
-
29
-
30
-
31
-
32
-
33
-
34
-
35
-
36
-
37
-
38
-
39
-
40
-
41
-
42
-
43
-
44
-
45
-
46
-
 47
47 -
 48
48 -
 49
49 -
 50
50 -
 51
51 -
 52
52 -
 53
53 -
 54
54 -
 55
55 -
 56
56 -
 57
57 -
 58
58 -
 59
59 -
 60
60 -
 61
61 -
 62
62 -
 63
63 -
 64
64 -
 65
65 -
 66
66 -
 67
67 -
68
-
69
-
70
-
71
-
72
-
73
-
74
-
75
-
76
-
77
-
78
-
79
-
80
-
81
-
82
-
83
-
84
-
85
-
86
-
87
-
88
-
89
-
90
-
91
-
92
-
93
-
94
-
95
-
96
-
97
-
98
-
99
-
100
-
101
-
102
-
103
-
104
-
105
-
106
-
107
-
108
-
109
-
110
-
111
-
112
-
113
-
114
-
115
-
116
-
117
-
118
-
119
-
120
-
121
-
122
-
123
-
124
-
125
-
126
-
127
-
128
-
129
-
130
-
131
-
132
-
133
-
134
-
135
-
136
-
137
-
138
-
139
-
140
-
141
-
142
-
143
-
144
-
145
-
146
-
147
-
148
-
149
-
150
-
151
-
152
-
153
-
154
-
155
-
156
-
157
-
158
-
159
-
160
-
161
-
162
-
163
-
164
-
165
-
166
-
167
-
168
-
169
-
170
-
171
-
172
-
173
-
174
-
175
-
176
-
177
-
178
-
179
-
180
-
181
-
182
-
183
-
184
-
185
-
186
-
187
-
188
-
189
-
190
-
191
-
192
-
193
-
194
-
195
-
196
-
197
-
198
-
199
-
200
-
201
-
202
-
203
-
204
-
205
-
206
-
207
-
208
-
209
-
210
-
211
-
212
-
213
-
214
-
215
-
216
-
217
-
218
-
219
-
220
-
221
-
222
-
223
-
224
-
225
-
226
-
227
-
228
-
229
-
230
-
231
-
232
-
233
-
234
-
235
-
236
-
237
-
238
-
239
-
240
-
241
-
242
-
243
-
244
-
245
-
246
-
247
-
248
-
249
-
250
-
251
-
252
-
253
-
254
-
255
-
256
-
257
 |
 |
55
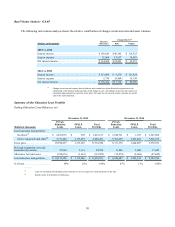
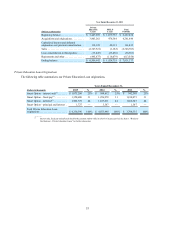
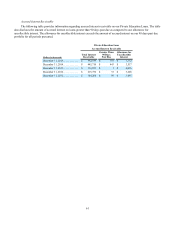
Private Education Loan Allowance for Loan Losses
In establishing the allowance for Private Education Loan losses as of December 31, 2015, we considered several factors
with respect to our Private Education Loan portfolio, in particular, credit quality and delinquency, forbearance and charge-off
trends.
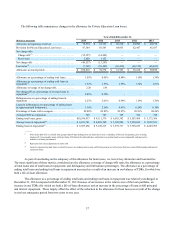
Private Education Loan provision for credit losses increased $4 million compared with the year-ago period. This increase
was primarily the result of a $1.3 billion increase in loans in repayment and a $206 million increase in loans classified as TDRs
for which we hold a life-of-loan allowance. The impact on provision expense from loan sales in 2014 compared with 2015 was
greater because we sold $306 million more in credit impaired loans in 2014 than in 2015. When we sell a credit impaired loan
at a loss, the loss is recorded as additional provision expense. Also included in 2014 provision expense was a $14 million
benefit from the change in our charge-off policy. For the first four months of 2014, we did not have TDRs, loans in forbearance
or a significant amount of loans that were more than 90 days past due because we typically sold loans to an affiliate prior to any
restructuring and when they became 90 days delinquent. As a result of this past practice, there were no charge-off or recoveries
of defaulted loans prior to April 30, 2014.
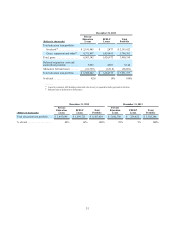
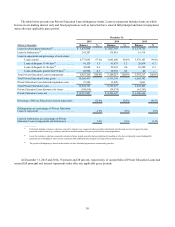
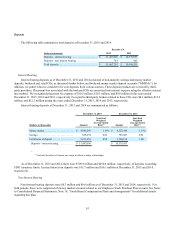
Total loans delinquent (as a percentage of loans in repayment) have increased to 2.2 percent from 2.0 percent in the year-
ago period. Loans in forbearance (as a percentage of loans in repayment and forbearance) have increased to 3.4 percent from
2.6 percent in the year-ago period. The increase in the delinquency rate and loans in forbearance was primarily due to the
significant increase in loans in full principal and interest repayment status, which increased to 35 percent of our total portfolio
at December 31, 2015 from 28 percent of our total portfolio at December 31, 2014.
For a more detailed discussion of our policy for determining the collectability of Private Education Loans and
maintaining our allowance for Private Education Loan losses, see Item 7. “Management’s Discussion and Analysis of Financial
Condition and Results of Operations — Critical Accounting Policies and Estimates — Allowance for Loan Losses.”
Our default aversion strategies are focused on the final stages of delinquency. Pre-Spin-Off, these final stages were from
150 days to 212 days delinquent. As a result of changing our corporate charge-off policy and greatly reducing the number of
potentially delinquent loans we sell to Navient, the final stages of delinquency and our default aversion strategies now focus
more on loans 30 to 120 days delinquent. This change has the effect of accelerating the recognition of losses due to the shorter
charge-off period. In addition, we changed our loss emergence period from two years to one year to reflect the shorter charge-
off policy and our revised servicing practices. A loss emergence period represents the expected period between the first
occurrence of an event likely to cause a loss on a loan and the date the loan is expected to be charged off, taking into
consideration account management practices that affect the timing of a loss, such as the usage of forbearance.
In connection with the Spin-Off, the agreement under which the Bank previously made loan sales was amended so the
Bank now only has the right to require Navient to purchase loans (at fair value) where (a) the borrower has a lending
relationship with both the Bank and Navient (“Split Loans”) and (b) the Split Loans either (1) are more than 90 days past due;
(2) have been restructured; (3) have been granted a hardship forbearance or more than six months of administrative
forbearance; or (4) have a borrower or cosigner who has filed for bankruptcy. At December 31, 2015, we held approximately
$89 million of Split Loans.
For the reasons described above, many of our historical credit indicators and period-over-period trends are not indicative
of future performance. The following results have not been adjusted to reflect what the delinquencies, charge-offs and
recoveries would have been had we not sold these loans. Because we now retain more delinquent loans, we believe it could take
up to two years after the date of the Spin-Off transaction before our credit performance indicators provide meaningful period-
over-period comparisons.