Sallie Mae 2015 Annual Report Download - page 43
Download and view the complete annual report
Please find page 43 of the 2015 Sallie Mae annual report below. You can navigate through the pages in the report by either clicking on the pages listed below, or by using the keyword search tool below to find specific information within the annual report.-
 1
1 -
2
-
3
-
4
-
5
-
6
-
7
-
8
-
9
-
10
-
11
-
12
-
13
-
14
-
15
-
16
-
17
-
18
-
19
-
20
-
21
-
22
-
23
-
24
-
25
-
26
-
27
-
28
-
29
-
30
-
31
-
32
-
 33
33 -
 34
34 -
 35
35 -
 36
36 -
 37
37 -
 38
38 -
 39
39 -
 40
40 -
 41
41 -
 42
42 -
 43
43 -
 44
44 -
 45
45 -
 46
46 -
 47
47 -
 48
48 -
 49
49 -
 50
50 -
 51
51 -
 52
52 -
 53
53 -
54
-
55
-
56
-
57
-
58
-
59
-
60
-
61
-
62
-
63
-
64
-
65
-
66
-
67
-
68
-
69
-
70
-
71
-
72
-
73
-
74
-
75
-
76
-
77
-
78
-
79
-
80
-
81
-
82
-
83
-
84
-
85
-
86
-
87
-
88
-
89
-
90
-
91
-
92
-
93
-
94
-
95
-
96
-
97
-
98
-
99
-
100
-
101
-
102
-
103
-
104
-
105
-
106
-
107
-
108
-
109
-
110
-
111
-
112
-
113
-
114
-
115
-
116
-
117
-
118
-
119
-
120
-
121
-
122
-
123
-
124
-
125
-
126
-
127
-
128
-
129
-
130
-
131
-
132
-
133
-
134
-
135
-
136
-
137
-
138
-
139
-
140
-
141
-
142
-
143
-
144
-
145
-
146
-
147
-
148
-
149
-
150
-
151
-
152
-
153
-
154
-
155
-
156
-
157
-
158
-
159
-
160
-
161
-
162
-
163
-
164
-
165
-
166
-
167
-
168
-
169
-
170
-
171
-
172
-
173
-
174
-
175
-
176
-
177
-
178
-
179
-
180
-
181
-
182
-
183
-
184
-
185
-
186
-
187
-
188
-
189
-
190
-
191
-
192
-
193
-
194
-
195
-
196
-
197
-
198
-
199
-
200
-
201
-
202
-
203
-
204
-
205
-
206
-
207
-
208
-
209
-
210
-
211
-
212
-
213
-
214
-
215
-
216
-
217
-
218
-
219
-
220
-
221
-
222
-
223
-
224
-
225
-
226
-
227
-
228
-
229
-
230
-
231
-
232
-
233
-
234
-
235
-
236
-
237
-
238
-
239
-
240
-
241
-
242
-
243
-
244
-
245
-
246
-
247
-
248
-
249
-
250
-
251
-
252
-
253
-
254
-
255
-
256
-
257
 |
 |
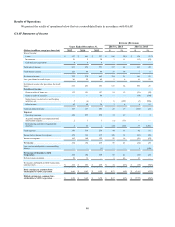
41
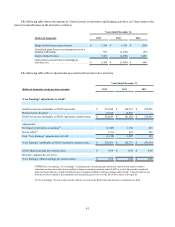
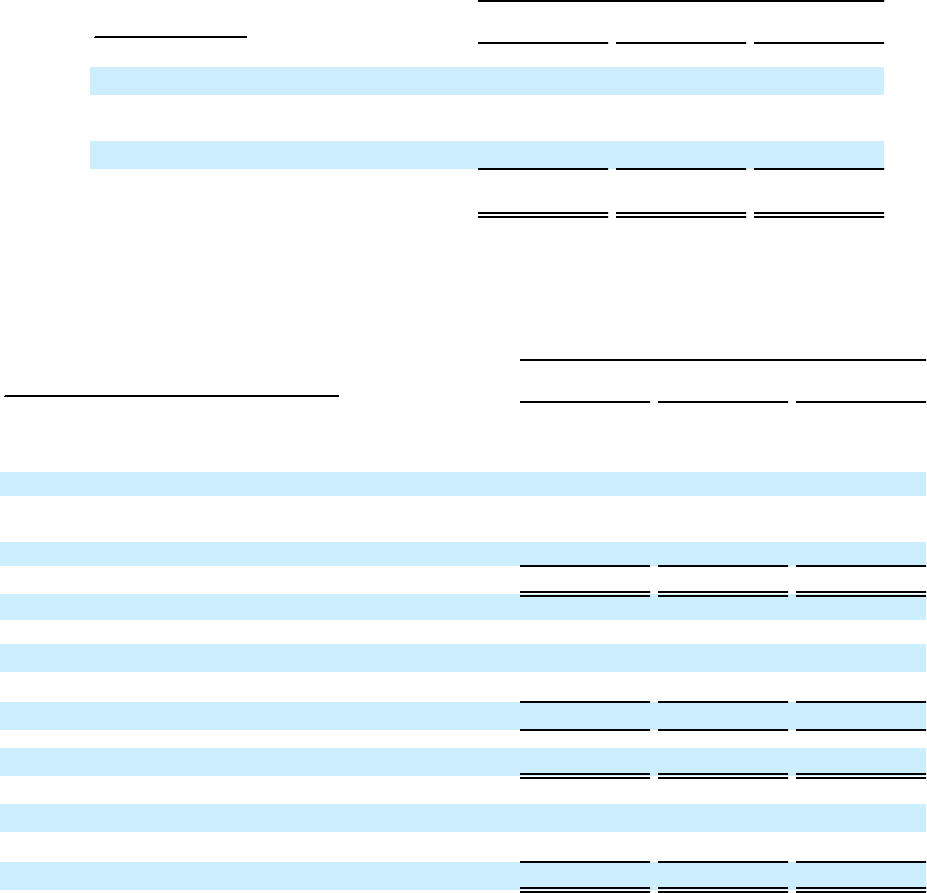
The following table shows the amount in “Gains (losses) on derivative and hedging activities, net” that relates to the
interest reclassification on the derivative contracts.
Years Ended December 31,
(Dollars in thousands) 2015 2014 2013
Hedge ineffectiveness gains (losses) . . . . . . . . . . . . $ 1,268 $ 1,198 $ (558)
Unrealized gains (losses) on instruments not in a
hedging relationship. . . . . . . . . . . . . . . . . . . . . . . . . 581 (2,944) (87)
Interest reclassification . . . . . . . . . . . . . . . . . . . . . . 3,451 (2,250) 1,285
Gains (losses) on derivatives and hedging
activities, net . . . . . . . . . . . . . . . . . . . . . . . . . . . . . . $ 5,300 $ (3,996) $ 640
The following table reflects adjustments associated with our derivative activities.
Years Ended December 31,
(Dollars in thousands, except per share amounts) 2015 2014 2013
“Core Earnings” adjustments to GAAP:
GAAP net income attributable to SLM Corporation . . . . . . . . . . . . . . $ 274,284 $ 194,219 $ 258,945
Preferred stock dividends . . . . . . . . . . . . . . . . . . . . . . . . . . . . . . . . . . . 19,595 12,933 —
GAAP net income attributable to SLM Corporation common stock . . $ 254,689 $ 181,286 $ 258,945
Adjustments:
Net impact of derivative accounting(1) . . . . . . . . . . . . . . . . . . . . . . . . . (1,849) 1,746 645
Net tax effect(2) . . . . . . . . . . . . . . . . . . . . . . . . . . . . . . . . . . . . . . . . . . . (711) 659 246
Total “Core Earnings” adjustments to GAAP. . . . . . . . . . . . . . . . . . . . (1,138) 1,087 399
“Core Earnings” attributable to SLM Corporation common stock. . . . $ 253,551 $ 182,373 $ 259,344
GAAP diluted earnings per common share. . . . . . . . . . . . . . . . . . . . . . $ 0.59 $ 0.42 $ 0.58
Derivative adjustments, net of tax. . . . . . . . . . . . . . . . . . . . . . . . . . . . . ———
“Core Earnings” diluted earnings per common share. . . . . . . . . . . . . . $ 0.59 $ 0.42 $ 0.58
______
(1) Derivative Accounting: “Core Earnings” exclude periodic unrealized gains and losses caused by the mark-to-market
valuations on derivatives that do not qualify for hedge accounting treatment under GAAP, as well as the periodic unrealized
gains and losses that are a result of ineffectiveness recognized related to effective hedges under GAAP. Under GAAP, for our
derivatives held to maturity, the cumulative net unrealized gain or loss over the life of the contract will equal $0.
(2) “Core Earnings” tax rate is based on the effective tax rate at the Bank where the derivative instruments are held.