Sallie Mae 2015 Annual Report Download - page 39
Download and view the complete annual report
Please find page 39 of the 2015 Sallie Mae annual report below. You can navigate through the pages in the report by either clicking on the pages listed below, or by using the keyword search tool below to find specific information within the annual report.
37
Item 6. Selected Financial Data.
Selected Financial Data 2011-2015
(Dollars in millions, except per share amounts)
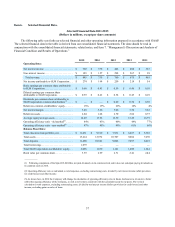
The following table sets forth our selected financial and other operating information prepared in accordance with GAAP.
The selected financial data in the table is derived from our consolidated financial statements. The data should be read in
conjunction with the consolidated financial statements, related notes, and Item 7. “Management’s Discussion and Analysis of
Financial Condition and Results of Operations.”
2015 2014 2013 2012 2011
Operating Data:
Net interest income . . . . . . . . . . . . . . . . . . . . . . $ 702 $ 578 $ 462 $ 408 $ 367
Non-interest income. . . . . . . . . . . . . . . . . . . . . . $ 183 $ 157 $ 298 $ 267 $ 98
Total revenue. . . . . . . . . . . . . . . . . . . . . . . . . . $ 885 $ 735 $ 760 $ 675 $ 465
Net income attributable to SLM Corporation . . $ 274 $ 194 $ 259 $ 218 $ 54
Basic earnings per common share attributable
to SLM Corporation. . . . . . . . . . . . . . . . . . . . . . $ 0.60 $ 0.43 $ 0.59 $ 0.46 $ 0.10
Diluted earnings per common share
attributable to SLM Corporation . . . . . . . . . . . . $ 0.59 $ 0.42 $ 0.58 $ 0.45 $ 0.10
Dividends per common share attributable to
SLM Corporation common shareholders(1) . . . . $ — $ — $ 0.60 $ 0.50 $ 0.30
Return on common stockholders’ equity. . . . . . 18% 15% 22% 18% 4%
Net interest margin. . . . . . . . . . . . . . . . . . . . . . . 5.48 5.26 5.06 5.54 5.22
Return on assets . . . . . . . . . . . . . . . . . . . . . . . . . 2.04 1.68 2.70 2.84 0.75
Average equity/average assets. . . . . . . . . . . . . . 14.49 13.92 12.50 15.49 16.79
Operating efficiency ratio - old method(2) . . . . . 44% 43% 40% 44% 77%
Operating efficiency ratio - new method(3) . . . . 47% 45% 49% 61% 66%
Balance Sheet Data:
Total education loan portfolio, net. . . . . . . . . . . $ 11,631 $ 9,510 $ 7,931 $ 6,487 $ 5,302
Total assets. . . . . . . . . . . . . . . . . . . . . . . . . . . . . 15,214 12,972 10,707 9,084 7,670
Total deposits. . . . . . . . . . . . . . . . . . . . . . . . . . . 11,488 10,541 9,002 7,497 6,018
Total borrowings . . . . . . . . . . . . . . . . . . . . . . . . 1,079 — — — —
Total SLM Corporation stockholders’ equity. . . 2,096 1,830 1,161 1,089 1,244
Book value per common share. . . . . . . . . . . . . . 3.59 2.99 2.71 2.41 2.44
_________
(1) Following completion of the Spin-Off, SLM has not paid dividends on its common stock and it does not anticipate paying dividends on
its common stock in 2016.
(2) Operating efficiency ratio is calculated as total expenses, excluding restructuring costs, divided by net interest income (after provision
for credit losses) and other income.
(3) As shown here, in 2016 the Company will change its calculation of operating efficiency ratio in future disclosures to investors to better
reflect the ongoing efficiency of the Company, as well as to be more consistent with the calculation used by our peers. The revised
calculation is total expenses, excluding restructuring costs, divided by net interest income (before provision for credit losses) and other
income, excluding gains on sales of loans.


