Sallie Mae 2015 Annual Report Download - page 118
Download and view the complete annual report
Please find page 118 of the 2015 Sallie Mae annual report below. You can navigate through the pages in the report by either clicking on the pages listed below, or by using the keyword search tool below to find specific information within the annual report.-
 1
1 -
2
-
3
-
4
-
5
-
6
-
7
-
8
-
9
-
10
-
11
-
12
-
13
-
14
-
15
-
16
-
17
-
18
-
19
-
20
-
21
-
22
-
23
-
24
-
25
-
26
-
27
-
28
-
29
-
30
-
31
-
32
-
33
-
34
-
35
-
36
-
37
-
38
-
39
-
40
-
41
-
42
-
43
-
44
-
45
-
46
-
47
-
48
-
49
-
50
-
51
-
52
-
53
-
54
-
55
-
56
-
57
-
58
-
59
-
60
-
61
-
62
-
63
-
64
-
65
-
66
-
67
-
68
-
69
-
70
-
71
-
72
-
73
-
74
-
75
-
76
-
77
-
78
-
79
-
80
-
81
-
82
-
83
-
84
-
85
-
86
-
87
-
88
-
89
-
90
-
91
-
92
-
93
-
94
-
95
-
96
-
97
-
98
-
99
-
100
-
101
-
102
-
103
-
104
-
105
-
106
-
107
-
 108
108 -
 109
109 -
 110
110 -
 111
111 -
 112
112 -
 113
113 -
 114
114 -
 115
115 -
 116
116 -
 117
117 -
 118
118 -
 119
119 -
 120
120 -
 121
121 -
 122
122 -
 123
123 -
 124
124 -
 125
125 -
 126
126 -
 127
127 -
 128
128 -
129
-
130
-
131
-
132
-
133
-
134
-
135
-
136
-
137
-
138
-
139
-
140
-
141
-
142
-
143
-
144
-
145
-
146
-
147
-
148
-
149
-
150
-
151
-
152
-
153
-
154
-
155
-
156
-
157
-
158
-
159
-
160
-
161
-
162
-
163
-
164
-
165
-
166
-
167
-
168
-
169
-
170
-
171
-
172
-
173
-
174
-
175
-
176
-
177
-
178
-
179
-
180
-
181
-
182
-
183
-
184
-
185
-
186
-
187
-
188
-
189
-
190
-
191
-
192
-
193
-
194
-
195
-
196
-
197
-
198
-
199
-
200
-
201
-
202
-
203
-
204
-
205
-
206
-
207
-
208
-
209
-
210
-
211
-
212
-
213
-
214
-
215
-
216
-
217
-
218
-
219
-
220
-
221
-
222
-
223
-
224
-
225
-
226
-
227
-
228
-
229
-
230
-
231
-
232
-
233
-
234
-
235
-
236
-
237
-
238
-
239
-
240
-
241
-
242
-
243
-
244
-
245
-
246
-
247
-
248
-
249
-
250
-
251
-
252
-
253
-
254
-
255
-
256
-
257
 |
 |

SLM CORPORATION
NOTES TO CONSOLIDATED FINANCIAL STATEMENTS (Continued)
(Dollars in thousands, unless otherwise noted)
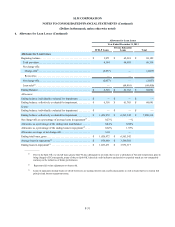
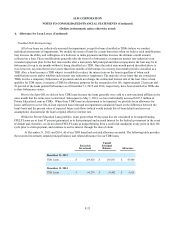
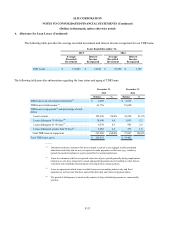
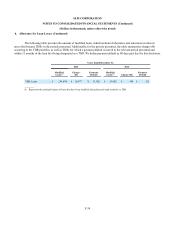
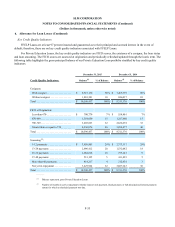
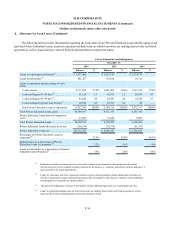
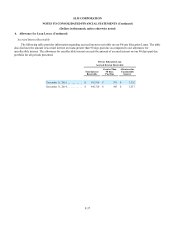
5. Loans Held for Investment (Continued)
F-28
During the first four months of 2014, and all of 2013, we did not utilize these collection tools because we sold loans that
would otherwise be managed using one or more of these collection tools to an entity that is now a subsidiary of Navient. See
Note 16, “Arrangements with Navient Corporation.”
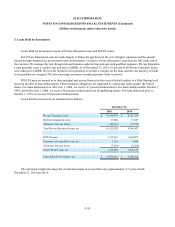
The period of delinquency for loans is based on the number of days scheduled payments are contractually past due. As of
December 31, 2015 and 2014, we had $122.9 million and $201.7 million, respectively, of FFELP loans and $20.9 million and
$10.7 million, respectively, of Private Education Loans held for investment which were more than 90 days delinquent that
continue to accrue interest. At December 31, 2015 and 2014, we had no loans in nonaccrual status.
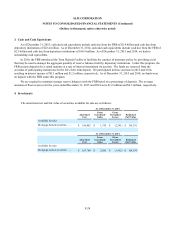
Borrower-in-Custody Arrangements
We maintain Borrower-in-Custody arrangements with the FRB. Under these arrangements, we can pledge FFELP
consolidation or Private Education Loans to the FRB to secure any advances and accrued interest generated under the Primary
Credit program at the FRB. As of December 31, 2015 and 2014, we had $0 and $0, respectively, of FFELP consolidation loans
and $1.7 billion and $1.4 billion, respectively, of Private Education Loans pledged to this borrowing facility, as discussed
further in Note 9, “Borrowings.”
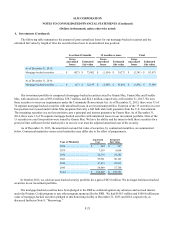
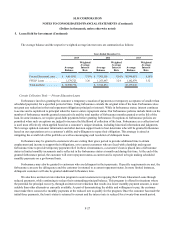
Loans Held for Investment by Region
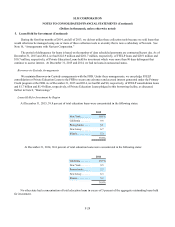
At December 31, 2015, 39.8 percent of total education loans were concentrated in the following states:
2015
New York . . . . . . . 10.1%
California . . . . . . . 9.6
Pennsylvania. . . . . 8.1
New Jersey . . . . . . 6.7
Illinois. . . . . . . . . . 5.3
39.8%
At December 31, 2014, 38.8 percent of total education loans were concentrated in the following states:
2014
California . . . . . . . 10.1%
New York . . . . . . . 9.5
Pennsylvania. . . . . 7.7
New Jersey . . . . . . 6.3
Illinois. . . . . . . . . . 5.2
38.8%
No other state had a concentration of total education loans in excess of 5 percent of the aggregate outstanding loans held
for investment.