Sallie Mae 2015 Annual Report Download - page 145
Download and view the complete annual report
Please find page 145 of the 2015 Sallie Mae annual report below. You can navigate through the pages in the report by either clicking on the pages listed below, or by using the keyword search tool below to find specific information within the annual report.-
 1
1 -
2
-
3
-
4
-
5
-
6
-
7
-
8
-
9
-
10
-
11
-
12
-
13
-
14
-
15
-
16
-
17
-
18
-
19
-
20
-
21
-
22
-
23
-
24
-
25
-
26
-
27
-
28
-
29
-
30
-
31
-
32
-
33
-
34
-
35
-
36
-
37
-
38
-
39
-
40
-
41
-
42
-
43
-
44
-
45
-
46
-
47
-
48
-
49
-
50
-
51
-
52
-
53
-
54
-
55
-
56
-
57
-
58
-
59
-
60
-
61
-
62
-
63
-
64
-
65
-
66
-
67
-
68
-
69
-
70
-
71
-
72
-
73
-
74
-
75
-
76
-
77
-
78
-
79
-
80
-
81
-
82
-
83
-
84
-
85
-
86
-
87
-
88
-
89
-
90
-
91
-
92
-
93
-
94
-
95
-
96
-
97
-
98
-
99
-
100
-
101
-
102
-
103
-
104
-
105
-
106
-
107
-
108
-
109
-
110
-
111
-
112
-
113
-
114
-
115
-
116
-
117
-
118
-
119
-
120
-
121
-
122
-
123
-
124
-
125
-
126
-
127
-
128
-
129
-
130
-
131
-
132
-
133
-
134
-
 135
135 -
 136
136 -
 137
137 -
 138
138 -
 139
139 -
 140
140 -
 141
141 -
 142
142 -
 143
143 -
 144
144 -
 145
145 -
 146
146 -
 147
147 -
 148
148 -
 149
149 -
 150
150 -
 151
151 -
 152
152 -
 153
153 -
 154
154 -
 155
155 -
156
-
157
-
158
-
159
-
160
-
161
-
162
-
163
-
164
-
165
-
166
-
167
-
168
-
169
-
170
-
171
-
172
-
173
-
174
-
175
-
176
-
177
-
178
-
179
-
180
-
181
-
182
-
183
-
184
-
185
-
186
-
187
-
188
-
189
-
190
-
191
-
192
-
193
-
194
-
195
-
196
-
197
-
198
-
199
-
200
-
201
-
202
-
203
-
204
-
205
-
206
-
207
-
208
-
209
-
210
-
211
-
212
-
213
-
214
-
215
-
216
-
217
-
218
-
219
-
220
-
221
-
222
-
223
-
224
-
225
-
226
-
227
-
228
-
229
-
230
-
231
-
232
-
233
-
234
-
235
-
236
-
237
-
238
-
239
-
240
-
241
-
242
-
243
-
244
-
245
-
246
-
247
-
248
-
249
-
250
-
251
-
252
-
253
-
254
-
255
-
256
-
257
 |
 |

SLM CORPORATION
NOTES TO CONSOLIDATED FINANCIAL STATEMENTS (Continued)
(Dollars in thousands, unless otherwise noted)
14. Stock-Based Compensation Plans and Arrangements (Continued)
F-55
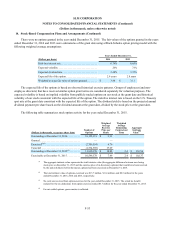
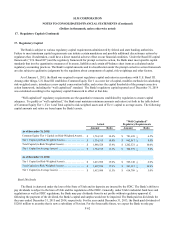
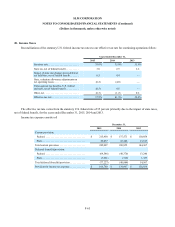
The following table summarizes RSU and PSU activity for the year ended December 31, 2015.
(Amounts in thousands, except per share data)
Number of
RSUs/
PSUs
Weighted
Average Grant
Date
Fair Value
Outstanding at December 31, 2014. . . . . . . . . . . . 6,279,743 $ 10.95
Granted . . . . . . . . . . . . . . . . . . . . . . . . . . . . . . . . . 2,466,593 9.45
Vested and converted to common stock(1). . . . . . . (2,796,739) 6.78
Canceled . . . . . . . . . . . . . . . . . . . . . . . . . . . . . . . . (109,209) 8.57
Outstanding at December 31, 2015(2) . . . . . . . . . . 5,840,388 $ 8.52
(1) The total fair value of RSUs/PSUs that vested and converted to common stock during the
years ended December 31, 2015, 2014 and 2013 was $18.9 million, $12.6 million and $6.4
million, respectively.
(2) As of December 31, 2015, there was $13.8 million of unrecognized compensation cost
related to RSUs net of estimated forfeitures, which is expected to be recognized over a
weighted average period of 1.9 years.
Employee Stock Purchase Plan
In the third quarter of 2014, we resumed offering the opportunity for employees to enroll in our ESPP. Employees may
purchase shares of our common stock at the end of a 12-month offering period at a price equal to the share price at the
beginning of the 12-month period, less 15 percent, up to a maximum purchase price of $7,500 (whole dollars). The purchase
price for each offering is determined at the beginning of the offering period on August 1.
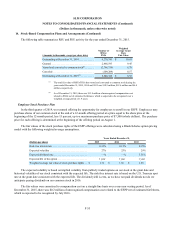
The fair values of the stock purchase rights of the ESPP offerings were calculated using a Black-Scholes option pricing
model with the following weighted average assumptions.
Years Ended December 31,
(Dollars per share) 2015 2014 2013
Risk-free interest rate . . . . . . . . . . . . . . . . . . . . . . . . . . . 0.33% 0.13% 0.15%
Expected volatility . . . . . . . . . . . . . . . . . . . . . . . . . . . . . 27% 25% 29%
Expected dividend rate . . . . . . . . . . . . . . . . . . . . . . . . . . —% —% 3.51%
Expected life of the option . . . . . . . . . . . . . . . . . . . . . . . 1 year 1 year 1 year
Weighted average fair value of stock purchase rights . . $ 1.74 $ 1.66 $ 2.95
The expected volatility is based on implied volatility from publicly traded options on our stock at the grant date and
historical volatility of our stock consistent with the expected life. The risk-free interest rate is based on the U.S. Treasury spot
rate at the grant date consistent with the expected life. The dividend yield is zero, as we have not paid dividends nor do we
anticipate paying dividends on our common stock in 2016.
The fair values were amortized to compensation cost on a straight-line basis over a one-year vesting period. As of
December 31, 2015, there was $0.2 million of unrecognized compensation cost related to the ESPP net of estimated forfeitures,
which is expected to be recognized by July 2016.