Sallie Mae 2015 Annual Report Download - page 65
Download and view the complete annual report
Please find page 65 of the 2015 Sallie Mae annual report below. You can navigate through the pages in the report by either clicking on the pages listed below, or by using the keyword search tool below to find specific information within the annual report.-
 1
1 -
2
-
3
-
4
-
5
-
6
-
7
-
8
-
9
-
10
-
11
-
12
-
13
-
14
-
15
-
16
-
17
-
18
-
19
-
20
-
21
-
22
-
23
-
24
-
25
-
26
-
27
-
28
-
29
-
30
-
31
-
32
-
33
-
34
-
35
-
36
-
37
-
38
-
39
-
40
-
41
-
42
-
43
-
44
-
45
-
46
-
47
-
48
-
49
-
50
-
51
-
52
-
53
-
54
-
 55
55 -
 56
56 -
 57
57 -
 58
58 -
 59
59 -
 60
60 -
 61
61 -
 62
62 -
 63
63 -
 64
64 -
 65
65 -
 66
66 -
 67
67 -
 68
68 -
 69
69 -
 70
70 -
 71
71 -
 72
72 -
 73
73 -
 74
74 -
 75
75 -
76
-
77
-
78
-
79
-
80
-
81
-
82
-
83
-
84
-
85
-
86
-
87
-
88
-
89
-
90
-
91
-
92
-
93
-
94
-
95
-
96
-
97
-
98
-
99
-
100
-
101
-
102
-
103
-
104
-
105
-
106
-
107
-
108
-
109
-
110
-
111
-
112
-
113
-
114
-
115
-
116
-
117
-
118
-
119
-
120
-
121
-
122
-
123
-
124
-
125
-
126
-
127
-
128
-
129
-
130
-
131
-
132
-
133
-
134
-
135
-
136
-
137
-
138
-
139
-
140
-
141
-
142
-
143
-
144
-
145
-
146
-
147
-
148
-
149
-
150
-
151
-
152
-
153
-
154
-
155
-
156
-
157
-
158
-
159
-
160
-
161
-
162
-
163
-
164
-
165
-
166
-
167
-
168
-
169
-
170
-
171
-
172
-
173
-
174
-
175
-
176
-
177
-
178
-
179
-
180
-
181
-
182
-
183
-
184
-
185
-
186
-
187
-
188
-
189
-
190
-
191
-
192
-
193
-
194
-
195
-
196
-
197
-
198
-
199
-
200
-
201
-
202
-
203
-
204
-
205
-
206
-
207
-
208
-
209
-
210
-
211
-
212
-
213
-
214
-
215
-
216
-
217
-
218
-
219
-
220
-
221
-
222
-
223
-
224
-
225
-
226
-
227
-
228
-
229
-
230
-
231
-
232
-
233
-
234
-
235
-
236
-
237
-
238
-
239
-
240
-
241
-
242
-
243
-
244
-
245
-
246
-
247
-
248
-
249
-
250
-
251
-
252
-
253
-
254
-
255
-
256
-
257
 |
 |

63
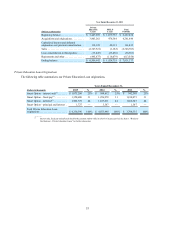
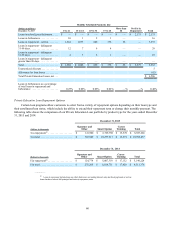
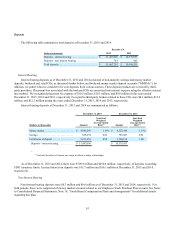
Deposits
The following table summarizes total deposits at December 31, 2015 and 2014.
December 31,
(Dollars in thousands) 2015 2014
Deposits - interest bearing . . . . . . . . . . . . . . . . . . . . $ 11,487,006 $ 10,539,953
Deposits - non-interest bearing . . . . . . . . . . . . . . . . 701 602
Total deposits. . . . . . . . . . . . . . . . . . . . . . . . . . . . . . $ 11,487,707 $ 10,540,555
Interest Bearing
Interest bearing deposits as of December 31, 2015 and 2014 consisted of non-maturity savings and money market
deposits, brokered and retail CDs, as discussed further below, and brokered money market deposit accounts (“MMDAs”). In
addition, we gather what we consider to be core deposits from various sources. These deposit products are serviced by third-
party providers. Placement fees associated with the brokered CDs are amortized into interest expense using the effective interest
rate method. We recognized placement fee expense of $10.5 million, $10.3 million, and $9.8 million in the years ended
December 31, 2015, 2014 and 2013, respectively. Fees paid to third-party brokers related to these CDs were $4.1 million, $15.2
million, and $12.1 million during the years ended December 31, 2015, 2014 and 2013, respectively.
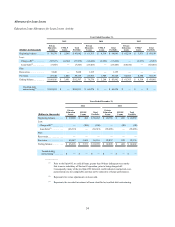
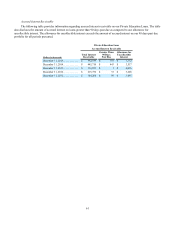
Interest bearing deposits at December 31, 2015 and 2014 are summarized as follows:
December 31, 2015 December 31, 2014
(Dollars in thousands) Amount
Year-End
Weighted
Average Stated
Rate(1) Amount
Year-End
Weighted
Average Stated
Rate(1)
Money market . . . . . . . . . . . . . . . . . . . . . . $ 4,886,299 1.19% $ 4,527,448 1.15%
Savings. . . . . . . . . . . . . . . . . . . . . . . . . . . . 669,254 0.82 703,687 0.81
Certificates of deposit . . . . . . . . . . . . . . . . 5,931,453 0.98 5,308,818 1.00
Deposits - interest bearing. . . . . . . . . . . . $ 11,487,006 $ 10,539,953
__
(1) Includes the effect of interest rate swaps in effective hedge relationships.
As of December 31, 2015 and 2014, there were $709.9 million and $254.0 million, respectively, of deposits exceeding
FDIC insurance limits. Accrued interest on deposits was $15.7 million and $16.1 million at December 31, 2015 and 2014,
respectively.
Non-Interest Bearing
Non-interest bearing deposits were $0.7 million and $0.6 million as of December 31, 2015 and 2014, respectively. For
both periods, these were comprised of money market accounts related to our Employee Stock Purchase Plan account. See Notes
to Consolidated Financial Statements, Note 14, “Stock-Based Compensation Plans and Arrangements” for additional details
regarding this plan.