Sallie Mae 2015 Annual Report Download - page 120
Download and view the complete annual report
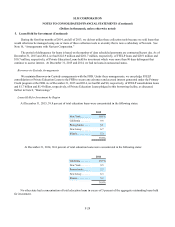
Please find page 120 of the 2015 Sallie Mae annual report below. You can navigate through the pages in the report by either clicking on the pages listed below, or by using the keyword search tool below to find specific information within the annual report.-
 1
1 -
2
-
3
-
4
-
5
-
6
-
7
-
8
-
9
-
10
-
11
-
12
-
13
-
14
-
15
-
16
-
17
-
18
-
19
-
20
-
21
-
22
-
23
-
24
-
25
-
26
-
27
-
28
-
29
-
30
-
31
-
32
-
33
-
34
-
35
-
36
-
37
-
38
-
39
-
40
-
41
-
42
-
43
-
44
-
45
-
46
-
47
-
48
-
49
-
50
-
51
-
52
-
53
-
54
-
55
-
56
-
57
-
58
-
59
-
60
-
61
-
62
-
63
-
64
-
65
-
66
-
67
-
68
-
69
-
70
-
71
-
72
-
73
-
74
-
75
-
76
-
77
-
78
-
79
-
80
-
81
-
82
-
83
-
84
-
85
-
86
-
87
-
88
-
89
-
90
-
91
-
92
-
93
-
94
-
95
-
96
-
97
-
98
-
99
-
100
-
101
-
102
-
103
-
104
-
105
-
106
-
107
-
108
-
109
-
 110
110 -
 111
111 -
 112
112 -
 113
113 -
 114
114 -
 115
115 -
 116
116 -
 117
117 -
 118
118 -
 119
119 -
 120
120 -
 121
121 -
 122
122 -
 123
123 -
 124
124 -
 125
125 -
 126
126 -
 127
127 -
 128
128 -
 129
129 -
 130
130 -
131
-
132
-
133
-
134
-
135
-
136
-
137
-
138
-
139
-
140
-
141
-
142
-
143
-
144
-
145
-
146
-
147
-
148
-
149
-
150
-
151
-
152
-
153
-
154
-
155
-
156
-
157
-
158
-
159
-
160
-
161
-
162
-
163
-
164
-
165
-
166
-
167
-
168
-
169
-
170
-
171
-
172
-
173
-
174
-
175
-
176
-
177
-
178
-
179
-
180
-
181
-
182
-
183
-
184
-
185
-
186
-
187
-
188
-
189
-
190
-
191
-
192
-
193
-
194
-
195
-
196
-
197
-
198
-
199
-
200
-
201
-
202
-
203
-
204
-
205
-
206
-
207
-
208
-
209
-
210
-
211
-
212
-
213
-
214
-
215
-
216
-
217
-
218
-
219
-
220
-
221
-
222
-
223
-
224
-
225
-
226
-
227
-
228
-
229
-
230
-
231
-
232
-
233
-
234
-
235
-
236
-
237
-
238
-
239
-
240
-
241
-
242
-
243
-
244
-
245
-
246
-
247
-
248
-
249
-
250
-
251
-
252
-
253
-
254
-
255
-
256
-
257
 |
 |
SLM CORPORATION
NOTES TO CONSOLIDATED FINANCIAL STATEMENTS (Continued)
(Dollars in thousands, unless otherwise noted)
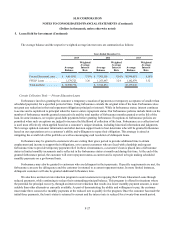
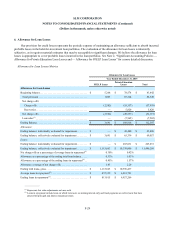
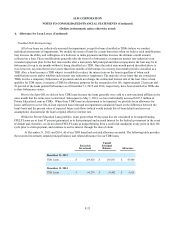
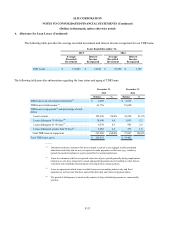
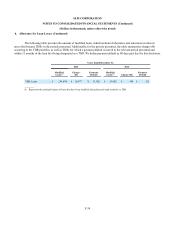
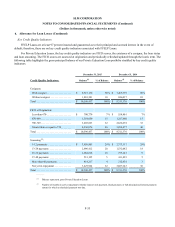
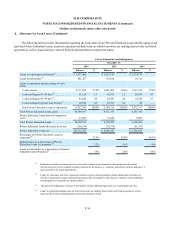
6. Allowance for Loan Losses (Continued)
F-30
Allowance for Loan Losses
Year Ended December 31, 2014
FFELP Loans Private Education
Loans Total
Allowance for Loan Losses
Beginning balance. . . . . . . . . . . . . . . . . . . . . . . . . . . . . . . . . . . . . $ 6,318 $ 61,763 $ 68,081
Total provision . . . . . . . . . . . . . . . . . . . . . . . . . . . . . . . . . . . . . . 1,946 83,583 85,529
Net charge-offs:
Charge-offs(1) . . . . . . . . . . . . . . . . . . . . . . . . . . . . . . . . . . . . . . (2,996) (14,442) (17,438)
Recoveries . . . . . . . . . . . . . . . . . . . . . . . . . . . . . . . . . . . . . . . . — 1,155 1,155
Net charge-offs. . . . . . . . . . . . . . . . . . . . . . . . . . . . . . . . . . . . . . (2,996) (13,287) (16,283)
Loan sales(2) . . . . . . . . . . . . . . . . . . . . . . . . . . . . . . . . . . . . . . . . — (53,485) (53,485)
Ending Balance . . . . . . . . . . . . . . . . . . . . . . . . . . . . . . . . . . . . . . . $ 5,268 $ 78,574 $ 83,842
Allowance:
Ending balance: individually evaluated for impairment. . . . . . . . $ — $ 9,815 $ 9,815
Ending balance: collectively evaluated for impairment . . . . . . . . $ 5,268 $ 68,759 $ 74,027
Loans:
Ending balance: individually evaluated for impairment. . . . . . . . $ — $ 59,402 $ 59,402
Ending balance: collectively evaluated for impairment . . . . . . . . $ 1,264,807 $ 8,251,974 $ 9,516,781
Net charge-offs as a percentage of average loans in repayment(3) 0.31% 0.30%
Allowance as a percentage of the ending total loan balance. . . . . 0.42% 0.95%
Allowance as a percentage of the ending loans in repayment(3) . . 0.57% 1.53%
Allowance coverage of net charge-offs. . . . . . . . . . . . . . . . . . . . . 1.76 5.91
Ending total loans, gross. . . . . . . . . . . . . . . . . . . . . . . . . . . . . . . . $ 1,264,807 $ 8,311,376
Average loans in repayment(3). . . . . . . . . . . . . . . . . . . . . . . . . . . . $ 972,390 $ 4,495,709
Ending loans in repayment(3). . . . . . . . . . . . . . . . . . . . . . . . . . . . . $ 926,891 $ 5,149,215
____________
(1) Prior to the Spin-Off, we sold all loans greater than 90 days delinquent to an entity that is now a subsidiary of Navient Corporation, prior to
being charged-off. Consequently, many of the pre-Spin-Off, historical credit indicators and period-over-period trends are not comparable
and may not be indicative of future performance.
(2) Represents fair value adjustments on loans sold.
(3) Loans in repayment include loans on which borrowers are making interest only and fixed payments as well as loans that have entered full
principal and interest repayment status.