Sallie Mae 2015 Annual Report Download - page 115
Download and view the complete annual report
Please find page 115 of the 2015 Sallie Mae annual report below. You can navigate through the pages in the report by either clicking on the pages listed below, or by using the keyword search tool below to find specific information within the annual report.-
 1
1 -
2
-
3
-
4
-
5
-
6
-
7
-
8
-
9
-
10
-
11
-
12
-
13
-
14
-
15
-
16
-
17
-
18
-
19
-
20
-
21
-
22
-
23
-
24
-
25
-
26
-
27
-
28
-
29
-
30
-
31
-
32
-
33
-
34
-
35
-
36
-
37
-
38
-
39
-
40
-
41
-
42
-
43
-
44
-
45
-
46
-
47
-
48
-
49
-
50
-
51
-
52
-
53
-
54
-
55
-
56
-
57
-
58
-
59
-
60
-
61
-
62
-
63
-
64
-
65
-
66
-
67
-
68
-
69
-
70
-
71
-
72
-
73
-
74
-
75
-
76
-
77
-
78
-
79
-
80
-
81
-
82
-
83
-
84
-
85
-
86
-
87
-
88
-
89
-
90
-
91
-
92
-
93
-
94
-
95
-
96
-
97
-
98
-
99
-
100
-
101
-
102
-
103
-
104
-
 105
105 -
 106
106 -
 107
107 -
 108
108 -
 109
109 -
 110
110 -
 111
111 -
 112
112 -
 113
113 -
 114
114 -
 115
115 -
 116
116 -
 117
117 -
 118
118 -
 119
119 -
 120
120 -
 121
121 -
 122
122 -
 123
123 -
 124
124 -
 125
125 -
126
-
127
-
128
-
129
-
130
-
131
-
132
-
133
-
134
-
135
-
136
-
137
-
138
-
139
-
140
-
141
-
142
-
143
-
144
-
145
-
146
-
147
-
148
-
149
-
150
-
151
-
152
-
153
-
154
-
155
-
156
-
157
-
158
-
159
-
160
-
161
-
162
-
163
-
164
-
165
-
166
-
167
-
168
-
169
-
170
-
171
-
172
-
173
-
174
-
175
-
176
-
177
-
178
-
179
-
180
-
181
-
182
-
183
-
184
-
185
-
186
-
187
-
188
-
189
-
190
-
191
-
192
-
193
-
194
-
195
-
196
-
197
-
198
-
199
-
200
-
201
-
202
-
203
-
204
-
205
-
206
-
207
-
208
-
209
-
210
-
211
-
212
-
213
-
214
-
215
-
216
-
217
-
218
-
219
-
220
-
221
-
222
-
223
-
224
-
225
-
226
-
227
-
228
-
229
-
230
-
231
-
232
-
233
-
234
-
235
-
236
-
237
-
238
-
239
-
240
-
241
-
242
-
243
-
244
-
245
-
246
-
247
-
248
-
249
-
250
-
251
-
252
-
253
-
254
-
255
-
256
-
257
 |
 |

SLM CORPORATION
NOTES TO CONSOLIDATED FINANCIAL STATEMENTS (Continued)
(Dollars in thousands, unless otherwise noted)
4. Investments (Continued)
F-25
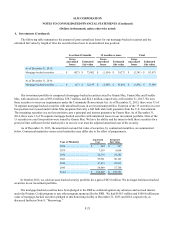
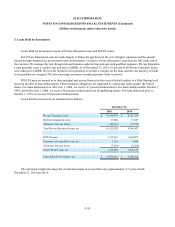
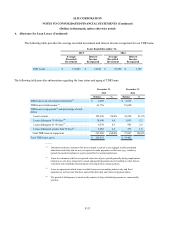
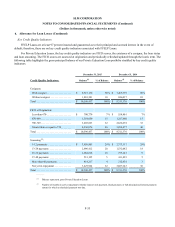
The following table summarizes the amount of gross unrealized losses for our mortgage-backed securities and the
estimated fair value by length of time the securities have been in an unrealized loss position:
Less than 12 months 12 months or more Total
Gross
unrealized
losses Estimated
fair value
Gross
unrealized
losses Estimated
fair value
Gross
unrealized
losses Estimated
fair value
As of December 31, 2015:
Mortgage-backed securities . . . . . . . $ (827) $ 73,802 $ (1,554) $ 39,271 $ (2,381) $ 113,073
As of December 31, 2014:
Mortgage-backed securities . . . . . . . $ (27) $ 12,147 $ (1,465) $ 41,462 $ (1,492) $ 53,609
Our investment portfolio is comprised of mortgage-backed securities issued by Ginnie Mae, Fannie Mae and Freddie
Mac, with amortized costs of $93.6 million, $78.7 million, and $24.1 million, respectively, at December 31, 2015. We own
these securities to meet our requirements under the Community Reinvestment Act. As of December 31, 2015, there were 35 of
74 separate mortgage-backed securities with unrealized losses in our investment portfolio. Fourteen of the 35 securities in a net
loss position were issued under Ginnie Mae programs that carry a full faith and credit guarantee from the U.S. Government.
The remaining securities in a net loss position carry a principal and interest guarantee by Fannie Mae. As of December 31,
2014, there were 13 of 56 separate mortgage-backed securities with unrealized losses in our investment portfolio. Nine of the
13 securities in a net loss position were issued by Ginnie Mae. We have the ability and the intent to hold these securities for a
period of time sufficient for the market price to recover to at least the adjusted amortized cost of the security.
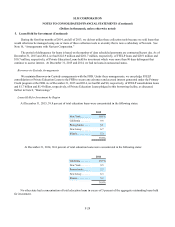
As of December 31, 2015, the amortized cost and fair value of securities, by contractual maturities, are summarized
below. Contractual maturities versus actual maturities may differ due to the effect of prepayments.
Year of Maturity Amortized
Cost Estimated
Fair Value
2038. . . . . . . . . . . . . . . . . . $ 284 $ 307
2039. . . . . . . . . . . . . . . . . . 7,539 8,054
2042. . . . . . . . . . . . . . . . . . 22,336 21,282
2043. . . . . . . . . . . . . . . . . . 59,961 60,165
2044. . . . . . . . . . . . . . . . . . 47,833 47,815
2045. . . . . . . . . . . . . . . . . . 58,449 57,768
Total. . . . . . . . . . . . . . . . . . $ 196,402 $ 195,391
In October 2013, we sold our asset-backed security portfolio for a gain of $63.8 million. We no longer hold asset-backed
securities in our investment portfolio.
The mortgage-backed securities have been pledged to the FRB as collateral against any advances and accrued interest
under the Primary Credit program or any other program sponsored by the FRB. We had $188.3 million and $160.9 million par
value of mortgage-backed securities pledged to this borrowing facility at December 31, 2015 and 2014, respectively, as
discussed further in Note 9, “Borrowings.”