Sallie Mae 2015 Annual Report Download - page 162
Download and view the complete annual report
Please find page 162 of the 2015 Sallie Mae annual report below. You can navigate through the pages in the report by either clicking on the pages listed below, or by using the keyword search tool below to find specific information within the annual report.-
 1
1 -
2
-
3
-
4
-
5
-
6
-
7
-
8
-
9
-
10
-
11
-
12
-
13
-
14
-
15
-
16
-
17
-
18
-
19
-
20
-
21
-
22
-
23
-
24
-
25
-
26
-
27
-
28
-
29
-
30
-
31
-
32
-
33
-
34
-
35
-
36
-
37
-
38
-
39
-
40
-
41
-
42
-
43
-
44
-
45
-
46
-
47
-
48
-
49
-
50
-
51
-
52
-
53
-
54
-
55
-
56
-
57
-
58
-
59
-
60
-
61
-
62
-
63
-
64
-
65
-
66
-
67
-
68
-
69
-
70
-
71
-
72
-
73
-
74
-
75
-
76
-
77
-
78
-
79
-
80
-
81
-
82
-
83
-
84
-
85
-
86
-
87
-
88
-
89
-
90
-
91
-
92
-
93
-
94
-
95
-
96
-
97
-
98
-
99
-
100
-
101
-
102
-
103
-
104
-
105
-
106
-
107
-
108
-
109
-
110
-
111
-
112
-
113
-
114
-
115
-
116
-
117
-
118
-
119
-
120
-
121
-
122
-
123
-
124
-
125
-
126
-
127
-
128
-
129
-
130
-
131
-
132
-
133
-
134
-
135
-
136
-
137
-
138
-
139
-
140
-
141
-
142
-
143
-
144
-
145
-
146
-
147
-
148
-
149
-
150
-
151
-
 152
152 -
 153
153 -
 154
154 -
 155
155 -
 156
156 -
 157
157 -
 158
158 -
 159
159 -
 160
160 -
 161
161 -
 162
162 -
 163
163 -
 164
164 -
 165
165 -
 166
166 -
 167
167 -
 168
168 -
 169
169 -
 170
170 -
 171
171 -
 172
172 -
173
-
174
-
175
-
176
-
177
-
178
-
179
-
180
-
181
-
182
-
183
-
184
-
185
-
186
-
187
-
188
-
189
-
190
-
191
-
192
-
193
-
194
-
195
-
196
-
197
-
198
-
199
-
200
-
201
-
202
-
203
-
204
-
205
-
206
-
207
-
208
-
209
-
210
-
211
-
212
-
213
-
214
-
215
-
216
-
217
-
218
-
219
-
220
-
221
-
222
-
223
-
224
-
225
-
226
-
227
-
228
-
229
-
230
-
231
-
232
-
233
-
234
-
235
-
236
-
237
-
238
-
239
-
240
-
241
-
242
-
243
-
244
-
245
-
246
-
247
-
248
-
249
-
250
-
251
-
252
-
253
-
254
-
255
-
256
-
257
 |
 |

SLM CORPORATION
NOTES TO CONSOLIDATED FINANCIAL STATEMENTS (Continued)
(Dollars in thousands, unless otherwise noted)
F-72
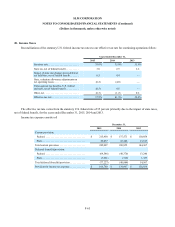
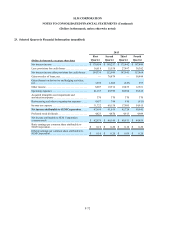
23. Selected Quarterly Financial Information (unaudited)
2015
First Second Third Fourth
(Dollars in thousands, except per share data) Quarter Quarter Quarter Quarter
Net interest income . . . . . . . . . . . . . . . . . . . . . . . . . . . $ 170,954 $ 168,257 $ 175,442 $ 187,846
Less: provisions for credit losses . . . . . . . . . . . . . . . . . 16,618 15,558 27,497 30,382
Net interest income after provisions for credit losses .154,336 152,699 147,945 157,464
Gains on sales of loans, net . . . . . . . . . . . . . . . . . . . . . — 76,874 — 58,484
Gains (losses) on derivative and hedging activities,
net. . . . . . . . . . . . . . . . . . . . . . . . . . . . . . . . . . . . . . . . . 3,292 1,602 (547) 953
Other income . . . . . . . . . . . . . . . . . . . . . . . . . . . . . . . . 8,007 10,912 10,455 12,561
Operating expenses . . . . . . . . . . . . . . . . . . . . . . . . . . . 81,187 89,799 92,864 85,245
Acquired intangible asset impairment and
amortization expense . . . . . . . . . . . . . . . . . . . . . . . . . . 370 370 370 370
Restructuring and other reorganization expenses . . . . 4,657 744 910 (913)
Income tax expense . . . . . . . . . . . . . . . . . . . . . . . . . . . 31,722 60,158 17,985 54,915
Net income attributable to SLM Corporation. . . . . 47,699 91,016 45,724 89,845
Preferred stock dividends. . . . . . . . . . . . . . . . . . . . . . . 4,823 4,870 4,913 4,989
Net income attributable to SLM Corporation
common stock . . . . . . . . . . . . . . . . . . . . . . . . . . . . . . . $ 42,876 $ 86,146 $ 40,811 $ 84,856
Basic earnings per common share attributable to
SLM Corporation . . . . . . . . . . . . . . . . . . . . . . . . . . . . . $ 0.10 $ 0.20 $ 0.10 $ 0.20
Diluted earnings per common share attributable to
SLM Corporation . . . . . . . . . . . . . . . . . . . . . . . . . . . . . $ 0.10 $ 0.20 $ 0.09 $ 0.20