Sallie Mae 2015 Annual Report Download - page 161
Download and view the complete annual report
Please find page 161 of the 2015 Sallie Mae annual report below. You can navigate through the pages in the report by either clicking on the pages listed below, or by using the keyword search tool below to find specific information within the annual report.-
 1
1 -
2
-
3
-
4
-
5
-
6
-
7
-
8
-
9
-
10
-
11
-
12
-
13
-
14
-
15
-
16
-
17
-
18
-
19
-
20
-
21
-
22
-
23
-
24
-
25
-
26
-
27
-
28
-
29
-
30
-
31
-
32
-
33
-
34
-
35
-
36
-
37
-
38
-
39
-
40
-
41
-
42
-
43
-
44
-
45
-
46
-
47
-
48
-
49
-
50
-
51
-
52
-
53
-
54
-
55
-
56
-
57
-
58
-
59
-
60
-
61
-
62
-
63
-
64
-
65
-
66
-
67
-
68
-
69
-
70
-
71
-
72
-
73
-
74
-
75
-
76
-
77
-
78
-
79
-
80
-
81
-
82
-
83
-
84
-
85
-
86
-
87
-
88
-
89
-
90
-
91
-
92
-
93
-
94
-
95
-
96
-
97
-
98
-
99
-
100
-
101
-
102
-
103
-
104
-
105
-
106
-
107
-
108
-
109
-
110
-
111
-
112
-
113
-
114
-
115
-
116
-
117
-
118
-
119
-
120
-
121
-
122
-
123
-
124
-
125
-
126
-
127
-
128
-
129
-
130
-
131
-
132
-
133
-
134
-
135
-
136
-
137
-
138
-
139
-
140
-
141
-
142
-
143
-
144
-
145
-
146
-
147
-
148
-
149
-
150
-
 151
151 -
 152
152 -
 153
153 -
 154
154 -
 155
155 -
 156
156 -
 157
157 -
 158
158 -
 159
159 -
 160
160 -
 161
161 -
 162
162 -
 163
163 -
 164
164 -
 165
165 -
 166
166 -
 167
167 -
 168
168 -
 169
169 -
 170
170 -
 171
171 -
172
-
173
-
174
-
175
-
176
-
177
-
178
-
179
-
180
-
181
-
182
-
183
-
184
-
185
-
186
-
187
-
188
-
189
-
190
-
191
-
192
-
193
-
194
-
195
-
196
-
197
-
198
-
199
-
200
-
201
-
202
-
203
-
204
-
205
-
206
-
207
-
208
-
209
-
210
-
211
-
212
-
213
-
214
-
215
-
216
-
217
-
218
-
219
-
220
-
221
-
222
-
223
-
224
-
225
-
226
-
227
-
228
-
229
-
230
-
231
-
232
-
233
-
234
-
235
-
236
-
237
-
238
-
239
-
240
-
241
-
242
-
243
-
244
-
245
-
246
-
247
-
248
-
249
-
250
-
251
-
252
-
253
-
254
-
255
-
256
-
257
 |
 |
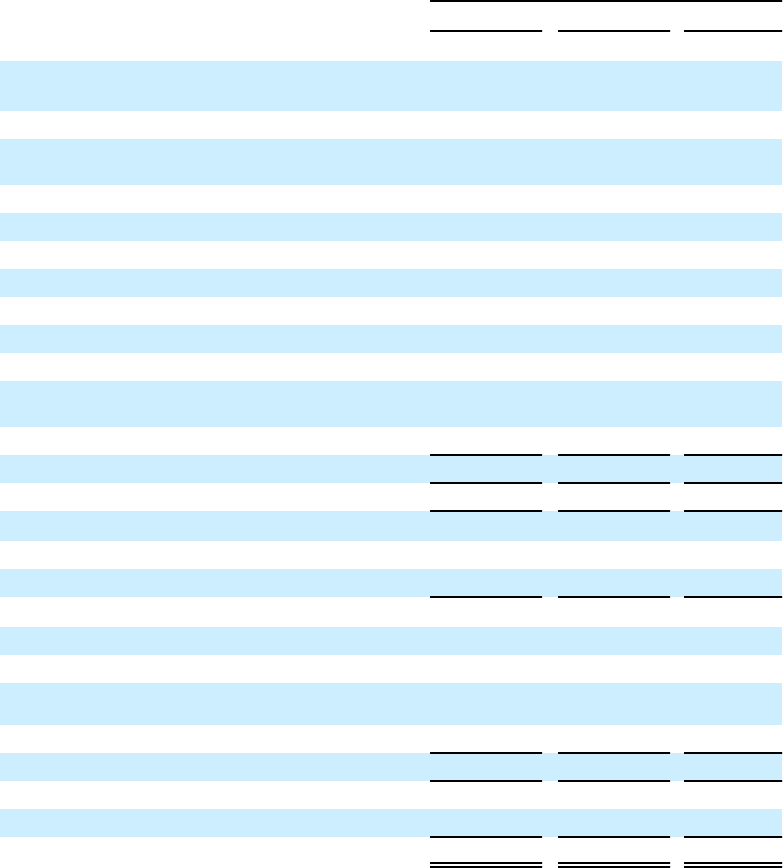
SLM CORPORATION
NOTES TO CONSOLIDATED FINANCIAL STATEMENTS (Continued)
(Dollars in thousands, unless otherwise noted)
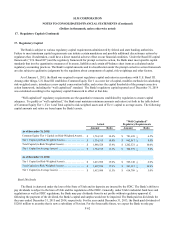
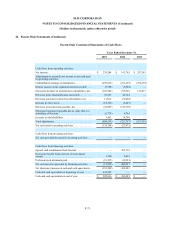
22. Parent Only Statements (Continued)
F-71
Parent Only Condensed Statements of Cash Flows
Years Ended December 31,
2015 2014 2013
Cash flows from operating activities:
Net income. . . . . . . . . . . . . . . . . . . . . . . . . . . . . . . . . . . $ 274,284 $ 193,785 $ 257,593
Adjustments to reconcile net income to net cash used
in operating activities:
Undistributed earnings of subsidiaries. . . . . . . . . . . . . . (295,638) (211,479) (394,270)
Interest income on tax indemnification receivable . . . . (5,398) (5,904) —
(Increase) decrease in investment in subsidiaries, net . . (103,602) 278,365 136,677
Decrease in tax indemnification receivable. . . . . . . . . . 59,633 44,724 —
Decrease (increase) in due from subsidiaries, net . . . . . 11,012 (32,408) —
Increase in other assets. . . . . . . . . . . . . . . . . . . . . . . . . . (14,366) (5,447) —
Decrease in income taxes payable, net . . . . . . . . . . . . . (54,907) (312,770) —
(Decrease) increase in payable due to entity that is a
subsidiary of Navient. . . . . . . . . . . . . . . . . . . . . . . . . . . (6,774) 8,764 —
Increase in other liabilities. . . . . . . . . . . . . . . . . . . . . . . 1,402 14,398 —
Total adjustments. . . . . . . . . . . . . . . . . . . . . . . . . . . . . . (408,638) (221,757) (257,593)
Net cash used in operating activities . . . . . . . . . . . . . . . (134,354) (27,972) —
Cash flows from investing activities:
Net cash provided by (used in) investing activities . . . . — — —
Cash flows from financing activities:
Special cash contribution from Navient. . . . . . . . . . . . . — 472,718 —
Excess tax benefit from exercise of stock-based
awards . . . . . . . . . . . . . . . . . . . . . . . . . . . . . . . . . . . . . . 1,740 2,432 —
Preferred stock dividends paid. . . . . . . . . . . . . . . . . . . . (19,595) (12,933) —
Net cash (used in) provided by financing activities. . . . (17,855) 462,217 —
Net (decrease) increase in cash and cash equivalents . . (152,209) 434,245 —
Cash and cash equivalents at beginning of year . . . . . . 434,245 — —
Cash and cash equivalents at end of year. . . . . . . . . . . . $ 282,036 $ 434,245 $ —