Sallie Mae 2015 Annual Report Download - page 49
Download and view the complete annual report
Please find page 49 of the 2015 Sallie Mae annual report below. You can navigate through the pages in the report by either clicking on the pages listed below, or by using the keyword search tool below to find specific information within the annual report.-
 1
1 -
2
-
3
-
4
-
5
-
6
-
7
-
8
-
9
-
10
-
11
-
12
-
13
-
14
-
15
-
16
-
17
-
18
-
19
-
20
-
21
-
22
-
23
-
24
-
25
-
26
-
27
-
28
-
29
-
30
-
31
-
32
-
33
-
34
-
35
-
36
-
37
-
38
-
 39
39 -
 40
40 -
 41
41 -
 42
42 -
 43
43 -
 44
44 -
 45
45 -
 46
46 -
 47
47 -
 48
48 -
 49
49 -
 50
50 -
 51
51 -
 52
52 -
 53
53 -
 54
54 -
 55
55 -
 56
56 -
 57
57 -
 58
58 -
 59
59 -
60
-
61
-
62
-
63
-
64
-
65
-
66
-
67
-
68
-
69
-
70
-
71
-
72
-
73
-
74
-
75
-
76
-
77
-
78
-
79
-
80
-
81
-
82
-
83
-
84
-
85
-
86
-
87
-
88
-
89
-
90
-
91
-
92
-
93
-
94
-
95
-
96
-
97
-
98
-
99
-
100
-
101
-
102
-
103
-
104
-
105
-
106
-
107
-
108
-
109
-
110
-
111
-
112
-
113
-
114
-
115
-
116
-
117
-
118
-
119
-
120
-
121
-
122
-
123
-
124
-
125
-
126
-
127
-
128
-
129
-
130
-
131
-
132
-
133
-
134
-
135
-
136
-
137
-
138
-
139
-
140
-
141
-
142
-
143
-
144
-
145
-
146
-
147
-
148
-
149
-
150
-
151
-
152
-
153
-
154
-
155
-
156
-
157
-
158
-
159
-
160
-
161
-
162
-
163
-
164
-
165
-
166
-
167
-
168
-
169
-
170
-
171
-
172
-
173
-
174
-
175
-
176
-
177
-
178
-
179
-
180
-
181
-
182
-
183
-
184
-
185
-
186
-
187
-
188
-
189
-
190
-
191
-
192
-
193
-
194
-
195
-
196
-
197
-
198
-
199
-
200
-
201
-
202
-
203
-
204
-
205
-
206
-
207
-
208
-
209
-
210
-
211
-
212
-
213
-
214
-
215
-
216
-
217
-
218
-
219
-
220
-
221
-
222
-
223
-
224
-
225
-
226
-
227
-
228
-
229
-
230
-
231
-
232
-
233
-
234
-
235
-
236
-
237
-
238
-
239
-
240
-
241
-
242
-
243
-
244
-
245
-
246
-
247
-
248
-
249
-
250
-
251
-
252
-
253
-
254
-
255
-
256
-
257
 |
 |
47
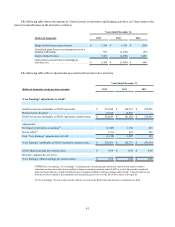
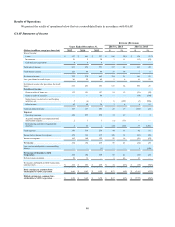
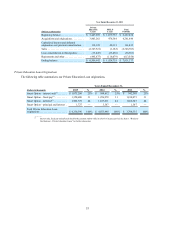
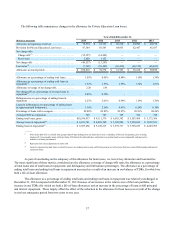
GAAP Consolidated Earnings Summary
Year Ended December 31, 2015 Compared with Year Ended December 31, 2014
For the year ended December 31, 2015, net income was $274 million, or $.59 diluted earnings per common share,
compared with net income of $194 million, or $.42 diluted earnings per common share for the year ended December 31, 2014.
The increase in net income was primarily due to a $124 million increase in net interest income and a $14 million increase in net
gains on sales of loans, which were partially offset by a $40 million increase in total expenses.
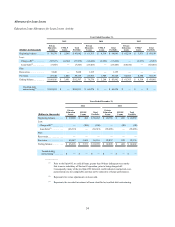
The primary contributors to each of the identified drivers of change in net income for the current year period compared
with the year-ago period are as follows:
• Net interest income increased by $124 million primarily due to a $2.3 billion increase in average Private Education
Loans outstanding and a 22 basis point increase in net interest margin. Net interest margin increased primarily as a
result of an increase in the ratio of higher yielding Private Education Loans relative to our other interest earning assets,
which more than offset a 14 basis point increase in our cost of funds. Cost of funds increased primarily as a result of
the use of higher cost funding such as our ABCP Facility and the issuance of $631 million in term ABS financing to
third-parties in July 2015 (which term ABS financing has a significantly longer average life and higher cost than
deposit funding). Costs of funds were also higher in 2015 because several interest rate swaps that were not designated
for hedge accounting treatment for seven months of 2014 were designated for the full year of 2015. Therefore, all
interest costs associated with these hedges were included in the cost of funds in 2015, as opposed to only five months
of interest costs in 2014.
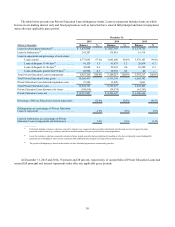
• Provisions for credit losses increased $5 million compared with the year-ago period. This increase was primarily as a
result of a $1.3 billion increase in Private Education Loans in repayment and a $206 million increase in Private
Education Loans classified as TDRs (where we provide for life-of-loan losses). The impact on provision expense from
loan sales in 2014 compared with 2015 was greater because we sold $306 million more in credit impaired loans in
2014 than in 2015. When we sell a credit impaired loan at a loss, the loss is recorded as additional provision expense.
Also included in 2014 provision expense was a $14 million benefit from the change in our charge-off policy.
• Gains on sales of loans, net, increased $14 million. In 2015, we sold $1.5 billion of loans through Private Education
Loan sales and a securitization transaction with third-parties. As a result, we recorded gains of $135 million. In 2014,
we sold $1.9 billion of loans through Private Education Loan sales and a securitization transaction with third-parties
and recorded gains of $121 million. Gains on sales of loans, net, were higher in the current period as these loans were
sold at a higher price.
• Gains (losses) on derivatives and hedging activities, net, resulted in a net gain of $5 million in 2015 compared with a
loss of $4 million in the year-ago period. The primary factors affecting the change were interest rates and whether
derivatives qualified for hedge accounting treatment. In 2015, we used more derivatives to economically hedge risk
that qualified for hedge accounting treatment than we did in the year-ago period.
• Operating expenses were $349 million compared with $275 million in the year-ago period. The year-over-year
increase in operating expenses was primarily the result of increased personnel costs related to being a stand-alone
company and an increase in loans serviced for the Company and third-parties. In addition, we made investments in our
servicing platform to improve customer service, such as expanding weekend service hours and improved response
times. Operating expenses in 2014 benefited from an $8 million reversal of reserves for remediation costs relating to
the FDIC Consent Order.
• Restructuring and other reorganization expenses were $5 million compared with $38 million in the year-ago period.
The decrease was primarily the result of the wind-down of our separation efforts related to the Spin-Off.
• The effective tax rate decreased to 37.5 percent in 2015 from 41.9 percent in 2014. The decrease in the effective tax
rate for 2015 was primarily the result of additional reserves recorded in fourth-quarter 2014 related to uncertain
historical tax positions and the release of reserves for uncertain tax positions and lower state tax rates in 2015, as a
result of the favorable outcome of several state matters.