Sallie Mae 2015 Annual Report Download - page 12
Download and view the complete annual report
Please find page 12 of the 2015 Sallie Mae annual report below. You can navigate through the pages in the report by either clicking on the pages listed below, or by using the keyword search tool below to find specific information within the annual report.-
 1
1 -
 2
2 -
 3
3 -
 4
4 -
 5
5 -
 6
6 -
 7
7 -
 8
8 -
 9
9 -
 10
10 -
 11
11 -
 12
12 -
 13
13 -
 14
14 -
 15
15 -
 16
16 -
 17
17 -
 18
18 -
 19
19 -
 20
20 -
 21
21 -
 22
22 -
23
-
24
-
25
-
26
-
27
-
28
-
29
-
30
-
31
-
32
-
33
-
34
-
35
-
36
-
37
-
38
-
39
-
40
-
41
-
42
-
43
-
44
-
45
-
46
-
47
-
48
-
49
-
50
-
51
-
52
-
53
-
54
-
55
-
56
-
57
-
58
-
59
-
60
-
61
-
62
-
63
-
64
-
65
-
66
-
67
-
68
-
69
-
70
-
71
-
72
-
73
-
74
-
75
-
76
-
77
-
78
-
79
-
80
-
81
-
82
-
83
-
84
-
85
-
86
-
87
-
88
-
89
-
90
-
91
-
92
-
93
-
94
-
95
-
96
-
97
-
98
-
99
-
100
-
101
-
102
-
103
-
104
-
105
-
106
-
107
-
108
-
109
-
110
-
111
-
112
-
113
-
114
-
115
-
116
-
117
-
118
-
119
-
120
-
121
-
122
-
123
-
124
-
125
-
126
-
127
-
128
-
129
-
130
-
131
-
132
-
133
-
134
-
135
-
136
-
137
-
138
-
139
-
140
-
141
-
142
-
143
-
144
-
145
-
146
-
147
-
148
-
149
-
150
-
151
-
152
-
153
-
154
-
155
-
156
-
157
-
158
-
159
-
160
-
161
-
162
-
163
-
164
-
165
-
166
-
167
-
168
-
169
-
170
-
171
-
172
-
173
-
174
-
175
-
176
-
177
-
178
-
179
-
180
-
181
-
182
-
183
-
184
-
185
-
186
-
187
-
188
-
189
-
190
-
191
-
192
-
193
-
194
-
195
-
196
-
197
-
198
-
199
-
200
-
201
-
202
-
203
-
204
-
205
-
206
-
207
-
208
-
209
-
210
-
211
-
212
-
213
-
214
-
215
-
216
-
217
-
218
-
219
-
220
-
221
-
222
-
223
-
224
-
225
-
226
-
227
-
228
-
229
-
230
-
231
-
232
-
233
-
234
-
235
-
236
-
237
-
238
-
239
-
240
-
241
-
242
-
243
-
244
-
245
-
246
-
247
-
248
-
249
-
250
-
251
-
252
-
253
-
254
-
255
-
256
-
257
 |
 |

10
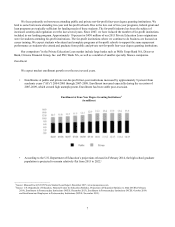
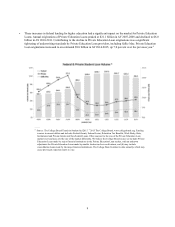
• We estimate total spending on higher education was $412 billion in the AY 2014-2015, up from $336 billion in the AY
2009-2010. Private Education Loans represent just 2 percent of total spending on higher education. Modest growth in
total spending can lead to meaningful increases in Private Education Loans in the absence of growth in other sources
of funding.7
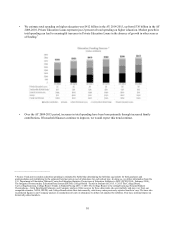
• Over the AY 2009-2015 period, increases in total spending have been born primarily through increased family
contributions. If household finances continue to improve, we would expect this trend continue.
_________________________
7 Source: Total post-secondary education spending is estimated by Sallie Mae determining the full-time equivalents for both graduates and
undergraduates and multiplying by the estimated total per person cost of attendance for each school type. In doing so, we utilize information from the
U.S. Department of Education, National Center for Education Statistics, Projections of Education Statistics to 2022 (NCES 2014-, February 2014),
The Integrated Postsecondary Education Data System (IPEDS), College Board -Trends in Student Aid 2015. © 2015 The College Board.
www.collegeboard.org, College Board -Trends in Student Pricing 2015. © 2015 The College Board. www.collegeboard.org, National Student
Clearinghouse - Term Enrollment Estimates, and Company analysis. Other sources for these data points also exist publicly and may vary from our
computed estimates. NCES, IPEDS, and College Board restate their data annually, which may cause previously reported results to vary. We have also
recalculated figures in our Company analysis to standardize all costs of attendance to dollars not adjusted for inflation. This has a minimal impact on
historically-stated numbers.