Sallie Mae 2015 Annual Report Download - page 9
Download and view the complete annual report
Please find page 9 of the 2015 Sallie Mae annual report below. You can navigate through the pages in the report by either clicking on the pages listed below, or by using the keyword search tool below to find specific information within the annual report.-
 1
1 -
 2
2 -
 3
3 -
 4
4 -
 5
5 -
 6
6 -
 7
7 -
 8
8 -
 9
9 -
 10
10 -
 11
11 -
 12
12 -
 13
13 -
 14
14 -
 15
15 -
 16
16 -
 17
17 -
 18
18 -
 19
19 -
 20
20 -
21
-
22
-
23
-
24
-
25
-
26
-
27
-
28
-
29
-
30
-
31
-
32
-
33
-
34
-
35
-
36
-
37
-
38
-
39
-
40
-
41
-
42
-
43
-
44
-
45
-
46
-
47
-
48
-
49
-
50
-
51
-
52
-
53
-
54
-
55
-
56
-
57
-
58
-
59
-
60
-
61
-
62
-
63
-
64
-
65
-
66
-
67
-
68
-
69
-
70
-
71
-
72
-
73
-
74
-
75
-
76
-
77
-
78
-
79
-
80
-
81
-
82
-
83
-
84
-
85
-
86
-
87
-
88
-
89
-
90
-
91
-
92
-
93
-
94
-
95
-
96
-
97
-
98
-
99
-
100
-
101
-
102
-
103
-
104
-
105
-
106
-
107
-
108
-
109
-
110
-
111
-
112
-
113
-
114
-
115
-
116
-
117
-
118
-
119
-
120
-
121
-
122
-
123
-
124
-
125
-
126
-
127
-
128
-
129
-
130
-
131
-
132
-
133
-
134
-
135
-
136
-
137
-
138
-
139
-
140
-
141
-
142
-
143
-
144
-
145
-
146
-
147
-
148
-
149
-
150
-
151
-
152
-
153
-
154
-
155
-
156
-
157
-
158
-
159
-
160
-
161
-
162
-
163
-
164
-
165
-
166
-
167
-
168
-
169
-
170
-
171
-
172
-
173
-
174
-
175
-
176
-
177
-
178
-
179
-
180
-
181
-
182
-
183
-
184
-
185
-
186
-
187
-
188
-
189
-
190
-
191
-
192
-
193
-
194
-
195
-
196
-
197
-
198
-
199
-
200
-
201
-
202
-
203
-
204
-
205
-
206
-
207
-
208
-
209
-
210
-
211
-
212
-
213
-
214
-
215
-
216
-
217
-
218
-
219
-
220
-
221
-
222
-
223
-
224
-
225
-
226
-
227
-
228
-
229
-
230
-
231
-
232
-
233
-
234
-
235
-
236
-
237
-
238
-
239
-
240
-
241
-
242
-
243
-
244
-
245
-
246
-
247
-
248
-
249
-
250
-
251
-
252
-
253
-
254
-
255
-
256
-
257
 |
 |
7
We focus primarily on borrowers attending public and private not-for-profit four-year degree granting institutions. We
lend to some borrowers attending two-year and for-profit schools. Due to the low cost of two-year programs, federal grant and
loan programs are typically sufficient for funding needs of these students. The for-profit industry has been the subject of
increased scrutiny and regulation over the last several years. Since 2007, we have reduced the number of for-profit institutions
included in our lending program. Approximately 10 percent or $430 million of our 2015 Private Education Loan originations
were for students attending for-profit institutions. The for-profit institutions where we continue to do business are focused on
career training. We expect students who attend and complete programs at for-profit schools to support the same repayment
performance as students who attend and graduate from public and private not-for-profit four-year degree granting institutions.
Our competitors1 in the Private Education Loan market include large banks such as Wells Fargo Bank NA, Discover
Bank, Citizens Financial Group, Inc. and PNC Bank NA, as well as a number of smaller specialty finance companies.
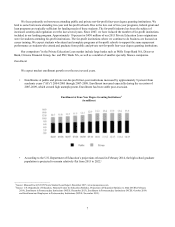
Enrollment
We expect modest enrollment growth over the next several years.
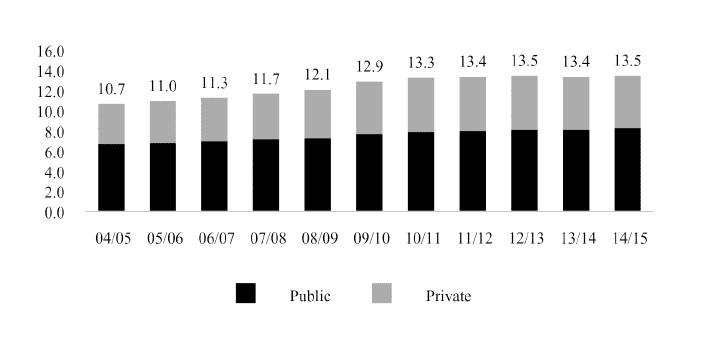
• Enrollments at public and private not-for-profit four-year institutions increased by approximately 9 percent from
academic years (“AYs”) 2004-2005 through 2007-2008. Enrollment increased especially during the recession of
2007-2009, which created high unemployment. Enrollment has been stable post-recession.
Enrollment at Four-Year Degree Granting Institutions2
(in millions)
• According to the U.S. Department of Education’s projections released in February 2014, the high school graduate
population is projected to remain relatively flat from 2015 to 2022.2
_________________________
1Source: MeasureOne Q3 2015 Private Student Loan Report, December 2015. www.measureone.com.
2Source: U.S. Department of Education, National Center for Education Statistics, Projections of Education Statistics to 2022 (NCES, February
2014), Enrollment in Postsecondary Institutions (NCES, December 2013), Enrollment in Postsecondary Institutions (NCES, October 2014)
and Enrollment and Employees in Postsecondary Institutions (NCES, November 2015).