Sallie Mae 2015 Annual Report Download - page 42
Download and view the complete annual report
Please find page 42 of the 2015 Sallie Mae annual report below. You can navigate through the pages in the report by either clicking on the pages listed below, or by using the keyword search tool below to find specific information within the annual report.-
 1
1 -
2
-
3
-
4
-
5
-
6
-
7
-
8
-
9
-
10
-
11
-
12
-
13
-
14
-
15
-
16
-
17
-
18
-
19
-
20
-
21
-
22
-
23
-
24
-
25
-
26
-
27
-
28
-
29
-
30
-
31
-
 32
32 -
 33
33 -
 34
34 -
 35
35 -
 36
36 -
 37
37 -
 38
38 -
 39
39 -
 40
40 -
 41
41 -
 42
42 -
 43
43 -
 44
44 -
 45
45 -
 46
46 -
 47
47 -
 48
48 -
 49
49 -
 50
50 -
 51
51 -
 52
52 -
53
-
54
-
55
-
56
-
57
-
58
-
59
-
60
-
61
-
62
-
63
-
64
-
65
-
66
-
67
-
68
-
69
-
70
-
71
-
72
-
73
-
74
-
75
-
76
-
77
-
78
-
79
-
80
-
81
-
82
-
83
-
84
-
85
-
86
-
87
-
88
-
89
-
90
-
91
-
92
-
93
-
94
-
95
-
96
-
97
-
98
-
99
-
100
-
101
-
102
-
103
-
104
-
105
-
106
-
107
-
108
-
109
-
110
-
111
-
112
-
113
-
114
-
115
-
116
-
117
-
118
-
119
-
120
-
121
-
122
-
123
-
124
-
125
-
126
-
127
-
128
-
129
-
130
-
131
-
132
-
133
-
134
-
135
-
136
-
137
-
138
-
139
-
140
-
141
-
142
-
143
-
144
-
145
-
146
-
147
-
148
-
149
-
150
-
151
-
152
-
153
-
154
-
155
-
156
-
157
-
158
-
159
-
160
-
161
-
162
-
163
-
164
-
165
-
166
-
167
-
168
-
169
-
170
-
171
-
172
-
173
-
174
-
175
-
176
-
177
-
178
-
179
-
180
-
181
-
182
-
183
-
184
-
185
-
186
-
187
-
188
-
189
-
190
-
191
-
192
-
193
-
194
-
195
-
196
-
197
-
198
-
199
-
200
-
201
-
202
-
203
-
204
-
205
-
206
-
207
-
208
-
209
-
210
-
211
-
212
-
213
-
214
-
215
-
216
-
217
-
218
-
219
-
220
-
221
-
222
-
223
-
224
-
225
-
226
-
227
-
228
-
229
-
230
-
231
-
232
-
233
-
234
-
235
-
236
-
237
-
238
-
239
-
240
-
241
-
242
-
243
-
244
-
245
-
246
-
247
-
248
-
249
-
250
-
251
-
252
-
253
-
254
-
255
-
256
-
257
 |
 |
40
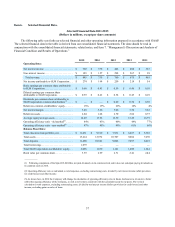
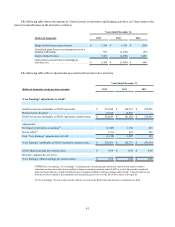
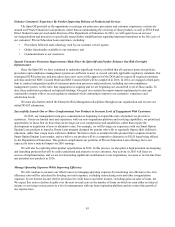
Operating Expenses
The cost of operating our business directly affects our profitability. Since the Spin-Off, our operating expenses include
those that are directly attributable to running our business, as well as the costs of building out our servicing and origination
platforms and establishing the Company as a stand-alone entity. We separately disclose “restructuring and other reorganization
expenses,” which represent costs we believe are one-time in nature and directly attributable to completing the Spin-Off.
Since the Spin-Off, we calculated our operating efficiency ratio as total expenses, excluding restructuring and other
reorganization expenses, divided by net interest income (after provisions for credit losses) and other income. Beginning in
2016, we intend to calculate and report our operating efficiency ratio as total expenses, excluding restructuring and other
reorganization expenses, divided by net interest income (before provision for credit losses) and other income, excluding gains
on sales of loans, net. We believe this change is necessary to improve visibility into our management of operating expenses
over time and eliminate any variability the timing of loan sales and credit losses would introduce into this ratio. This
methodology is more consistent with the calculation used by our peers. Computed on this basis, for the year ended December
31, 2015, our operating efficiency ratio would have been 47 percent compared to 45 percent from the year-ago period. Our
long-term objective is to achieve steady declines in this ratio over the next several years.
Core Earnings
We prepare financial statements in accordance with GAAP. However, we also produce and report our after-tax earnings
on a separate basis which we refer to as “Core Earnings.” While pre-Spin-Off SLM also reported a metric by that name, what
we now report and what we describe below is significantly different and should not be compared to any Core Earnings reported
by pre-Spin-Off SLM. The difference between our “Core Earnings” and GAAP results for periods presented generally is driven
by the unrealized, mark-to-market gains (losses) on derivatives contracts recognized in GAAP, but not in “Core Earnings.”
“Core Earnings” recognizes the difference in accounting treatment based upon whether a derivative qualifies for hedge
accounting treatment and eliminates the earnings impact associated with hedge ineffectiveness and derivatives we use as an
economic hedge but which do not qualify for hedge accounting treatment. We enter into derivatives instruments to
economically hedge interest rate and cash flow risk associated with our portfolio. We believe that our derivatives are effective
economic hedges, and as such, are a critical element of our interest rate risk management strategy. Those derivative instruments
that qualify for hedge accounting treatment have their related cash flows recorded in interest income or interest expense along
with the hedged item. Hedge ineffectiveness related to these derivatives is recorded in “Gains (losses) on derivatives and
hedging activities, net.” Some of our derivatives do not qualify for hedge accounting treatment and the stand-alone derivative
must be marked-to-fair value in the income statement with no consideration for the corresponding change in fair value of the
hedged item. These gains and losses, recorded in “Gains (losses) on derivative and hedging activities, net,” are primarily
caused by interest rate volatility and changing credit spreads during the period as well as the volume and term of derivatives not
receiving hedge accounting treatment. Cash flows on derivative instruments that do not qualify for hedge accounting are not
recorded in interest income and interest expense; they are recorded in non-interest income: “Gains (losses) on derivative and
hedging activities, net.”
The adjustments required to reconcile from our “Core Earnings” results to our GAAP results of operations, net of tax,
relate to differing treatments for our use of derivative instruments to hedge our economic risks that do not qualify for hedge
accounting treatment or do qualify for hedge accounting treatment but result in ineffectiveness, net of tax. The amount recorded
in “Gains (losses) on derivative and hedging activities, net” includes the accrual of the current payment on the interest rate
swaps that do not qualify for hedge accounting treatment as well as the change in fair values related to future expected cash
flows for derivatives that do not qualify for hedge accounting and ineffectiveness on derivatives that receive hedge accounting
treatment. For purposes of “Core Earnings”, we are including in GAAP earnings the current period accrual amounts (interest
reclassification) on the swaps and exclude the remaining ineffectiveness. “Core Earnings” is meant to represent what earnings
would have been had these derivatives qualified for hedge accounting and there was no ineffectiveness.
“Core Earnings” are not a substitute for reported results under GAAP. We provide “Core Earnings” basis of presentation
because (i) earnings per share computed on a “Core Earnings” basis is one of several measures we utilize in establishing
management incentive compensation and (ii) we believe it better reflects the financial results for derivatives that are economic
hedges of interest rate risk but which do not qualify for hedge accounting treatment.
GAAP provides a uniform, comprehensive basis of accounting. Our “Core Earnings” basis of presentation differs from
GAAP in the way it treats derivatives as described above.