PNC Bank 2010 Annual Report Download - page 91
Download and view the complete annual report
Please find page 91 of the 2010 PNC Bank annual report below. You can navigate through the pages in the report by either clicking on the pages listed below, or by using the keyword search tool below to find specific information within the annual report.-
 1
1 -
2
-
3
-
4
-
5
-
6
-
7
-
8
-
9
-
10
-
11
-
12
-
13
-
14
-
15
-
16
-
17
-
18
-
19
-
20
-
21
-
22
-
23
-
24
-
25
-
26
-
27
-
28
-
29
-
30
-
31
-
32
-
33
-
34
-
35
-
36
-
37
-
38
-
39
-
40
-
41
-
42
-
43
-
44
-
45
-
46
-
47
-
48
-
49
-
50
-
51
-
52
-
53
-
54
-
55
-
56
-
57
-
58
-
59
-
60
-
61
-
62
-
63
-
64
-
65
-
66
-
67
-
68
-
69
-
70
-
71
-
72
-
73
-
74
-
75
-
76
-
77
-
78
-
79
-
80
-
 81
81 -
 82
82 -
 83
83 -
 84
84 -
 85
85 -
 86
86 -
 87
87 -
 88
88 -
 89
89 -
 90
90 -
 91
91 -
 92
92 -
 93
93 -
 94
94 -
 95
95 -
 96
96 -
 97
97 -
 98
98 -
 99
99 -
 100
100 -
 101
101 -
102
-
103
-
104
-
105
-
106
-
107
-
108
-
109
-
110
-
111
-
112
-
113
-
114
-
115
-
116
-
117
-
118
-
119
-
120
-
121
-
122
-
123
-
124
-
125
-
126
-
127
-
128
-
129
-
130
-
131
-
132
-
133
-
134
-
135
-
136
-
137
-
138
-
139
-
140
-
141
-
142
-
143
-
144
-
145
-
146
-
147
-
148
-
149
-
150
-
151
-
152
-
153
-
154
-
155
-
156
-
157
-
158
-
159
-
160
-
161
-
162
-
163
-
164
-
165
-
166
-
167
-
168
-
169
-
170
-
171
-
172
-
173
-
174
-
175
-
176
-
177
-
178
-
179
-
180
-
181
-
182
-
183
-
184
-
185
-
186
-
187
-
188
-
189
-
190
-
191
-
192
-
193
-
194
-
195
-
196
-
197
-
198
-
199
-
200
-
201
-
202
-
203
-
204
-
205
-
206
-
207
-
208
-
209
-
210
-
211
-
212
-
213
-
214
 |
 |

buyouts, recapitalizations, and growth financings in a variety of
industries. We also have investments in affiliated and
non-affiliated funds that make similar investments in private
equity and in debt and equity-oriented hedge funds. The
economic and/or book value of these investments and other
assets such as loan servicing rights are directly affected by
changes in market factors.
The primary risk measurement for equity and other
investments is economic capital. Economic capital is a
common measure of risk for credit, market and operational
risk. It is an estimate of the worst-case value depreciation over
a one year horizon to a level commensurate with a financial
institution with an A rating by the credit rating agencies.
Given the illiquid nature of many of these types of
investments, it can be a challenge to determine their fair
values. Market Risk Management and Finance provide
independent oversight of the valuation process.
Various PNC business units manage our private equity and
other investment activities. Our businesses are responsible for
making investment decisions within the approved policy limits
and associated guidelines.
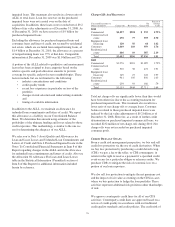
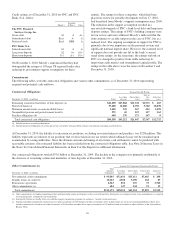
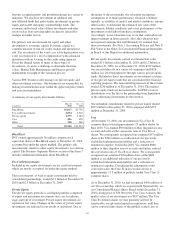
A summary of our equity investments follows:
In millions
Dec. 31
2010
Dec. 31
2009
BlackRock $5,017 $5,736
Tax credit investments 2,054 2,510
Private equity 1,375 1,184
Visa 456 456
Other 318 368
Total $9,220 $10,254
BlackRock
PNC owned approximately 36 million common stock
equivalent shares of BlackRock equity at December 31, 2010,
accounted for under the equity method. The primary risk
measurement, similar to other equity investments, is economic
capital. The Business Segments Review section of this Item 7
includes additional information about BlackRock.
Tax Credit Investments
Included in our equity investments are tax credit investments
which are mostly accounted for under the equity method.
These investments, as well as equity investments held by
consolidated partnerships, totaled $2.1 billion at December 31,
2010 and $2.5 billion at December 31, 2009.
Private Equity
The private equity portfolio is an illiquid portfolio comprised
of equity and mezzanine investments that vary by industry,
stage and type of investment. Private equity investments are
reported at fair value. Changes in the values of private equity
investments are reflected in our results of operations. Due to
the nature of the investments, the valuations incorporate
assumptions as to future performance, financial condition,
liquidity, availability of capital, and market conditions, among
other factors, to determine the estimated fair value of the
investments. Market conditions and actual performance of the
investments could differ from these assumptions.
Accordingly, lower valuations may occur that could adversely
impact earnings in future periods. Also, the valuations may
not represent amounts that will ultimately be realized from
these investments. See Note 1 Accounting Policies and Note 8
Fair Value in the Notes To Consolidated Financial Statements
in Item 8 of this Report for additional information.
Private equity investments carried at estimated fair value
totaled $1.4 billion at December 31, 2010 and $1.2 billion at
December 31, 2009. As of December 31, 2010, $749 million
was invested directly in a variety of companies and $626
million was invested indirectly through various private equity
funds. Included in direct investments are investment activities
of two private equity funds that are consolidated for financial
reporting purposes. The noncontrolling interests of these funds
totaled $236 million as of December 31, 2010. The indirect
private equity funds are not redeemable, but PNC receives
distributions over the life of the partnership from liquidation
of the underlying investments by the investee.
Our unfunded commitments related to private equity totaled
$319 million at December 31, 2010 compared with $453
million at December 31, 2009.
Visa
At December 31, 2010, our investment in Visa Class B
common shares totaled approximately 23 million shares. In
May 2010, Visa funded $500 million to their litigation escrow
account and reduced the conversion ratio of Visa B to A
shares. We consequently recognized our estimated $47 million
share of the $500 million as a reduction of our previously
established indemnification liability and a reduction of
noninterest expense. In October 2010, Visa funded $800
million to their litigation escrow account and further reduced
the conversion ratio of Visa B to A shares. We consequently
recognized our estimated $76 million share of the $800
million as an additional reduction of our previously
established indemnification liability and a reduction of
noninterest expense. Considering the adjustments to the
conversion ratio, the Class B shares would convert to
approximately 11.9 million of publicly traded Visa Class A
common shares.
As of December 31, 2010, we had recognized $456 million of
our Visa ownership, which we acquired with National City, on
our Consolidated Balance Sheet. Based on the December 31,
2010 closing price of $70.38 for the Visa Class A shares, the
market value of our investment was $837 million. The Visa
Class B common shares we own generally will not be
transferable, except under limited circumstances, until they
can be converted into shares of the publicly traded class of
83