PNC Bank 2010 Annual Report Download - page 42
Download and view the complete annual report
Please find page 42 of the 2010 PNC Bank annual report below. You can navigate through the pages in the report by either clicking on the pages listed below, or by using the keyword search tool below to find specific information within the annual report.-
 1
1 -
2
-
3
-
4
-
5
-
6
-
7
-
8
-
9
-
10
-
11
-
12
-
13
-
14
-
15
-
16
-
17
-
18
-
19
-
20
-
21
-
22
-
23
-
24
-
25
-
26
-
27
-
28
-
29
-
30
-
31
-
 32
32 -
 33
33 -
 34
34 -
 35
35 -
 36
36 -
 37
37 -
 38
38 -
 39
39 -
 40
40 -
 41
41 -
 42
42 -
 43
43 -
 44
44 -
 45
45 -
 46
46 -
 47
47 -
 48
48 -
 49
49 -
 50
50 -
 51
51 -
 52
52 -
53
-
54
-
55
-
56
-
57
-
58
-
59
-
60
-
61
-
62
-
63
-
64
-
65
-
66
-
67
-
68
-
69
-
70
-
71
-
72
-
73
-
74
-
75
-
76
-
77
-
78
-
79
-
80
-
81
-
82
-
83
-
84
-
85
-
86
-
87
-
88
-
89
-
90
-
91
-
92
-
93
-
94
-
95
-
96
-
97
-
98
-
99
-
100
-
101
-
102
-
103
-
104
-
105
-
106
-
107
-
108
-
109
-
110
-
111
-
112
-
113
-
114
-
115
-
116
-
117
-
118
-
119
-
120
-
121
-
122
-
123
-
124
-
125
-
126
-
127
-
128
-
129
-
130
-
131
-
132
-
133
-
134
-
135
-
136
-
137
-
138
-
139
-
140
-
141
-
142
-
143
-
144
-
145
-
146
-
147
-
148
-
149
-
150
-
151
-
152
-
153
-
154
-
155
-
156
-
157
-
158
-
159
-
160
-
161
-
162
-
163
-
164
-
165
-
166
-
167
-
168
-
169
-
170
-
171
-
172
-
173
-
174
-
175
-
176
-
177
-
178
-
179
-
180
-
181
-
182
-
183
-
184
-
185
-
186
-
187
-
188
-
189
-
190
-
191
-
192
-
193
-
194
-
195
-
196
-
197
-
198
-
199
-
200
-
201
-
202
-
203
-
204
-
205
-
206
-
207
-
208
-
209
-
210
-
211
-
212
-
213
-
214
 |
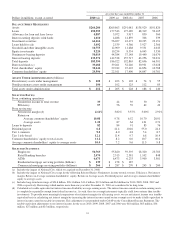
 |

C
ONSOLIDATED
B
ALANCE
S
HEET
R
EVIEW
S
UMMARIZED
B
ALANCE
S
HEET
D
ATA
In millions
Dec. 31
2010
Dec. 31
2009
Assets
Loans $150,595 $157,543
Investment securities 64,262 56,027
Cash and short-term investments 10,437 13,290
Loans held for sale 3,492 2,539
Goodwill and other intangible assets 10,753 12,909
Equity investments 9,220 10,254
Other, net 15,525 17,301
Total assets $264,284 $269,863
Liabilities
Deposits $183,390 $186,922
Borrowed funds 39,488 39,261
Other 8,568 11,113
Total liabilities 231,446 237,296
Total shareholders’ equity 30,242 29,942
Noncontrolling interests 2,596 2,625
Total equity 32,838 32,567
Total liabilities and equity $264,284 $269,863
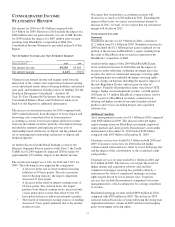
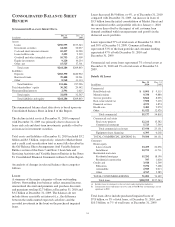
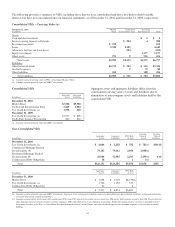
The summarized balance sheet data above is based upon our
Consolidated Balance Sheet in Item 8 of this Report.
The decline in total assets at December 31, 2010 compared
with December 31, 2009 was primarily due to decreases in
loans and cash and short-term investments, partially offset by
an increase in investment securities.
Total assets and liabilities at December 31, 2010 included $5.2
billion and $3.5 billion, respectively, related to Market Street
and a credit card securitization trust as more fully described in
the Off-Balance Sheet Arrangements And Variable Interest
Entities section of this Item 7 and Note 3 Loan Sale and
Servicing Activities and Variable Interest Entities in the Notes
To Consolidated Financial Statements in Item 8 of this Report.
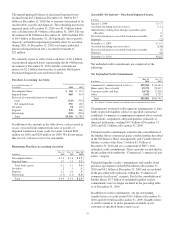
An analysis of changes in selected balance sheet categories
follows.
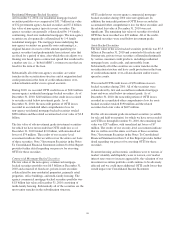
L
OANS
A summary of the major categories of loans outstanding
follows. Outstanding loan balances reflect unearned income,
unamortized discount and premium, and purchase discounts
and premiums totaling $2.7 billion at December 31, 2010 and
$3.2 billion at December 31, 2009. The balances do not
include future accretable net interest (i.e., the difference
between the undiscounted expected cash flows and the
recorded investment in the loan) on the purchased impaired
loans.
Loans decreased $6.9 billion, or 4%, as of December 31, 2010
compared with December 31, 2009. An increase in loans of
$3.5 billion from the initial consolidation of Market Street and
the securitized credit card portfolio effective January 1, 2010
was more than offset by the impact of soft customer loan
demand combined with loan repayments and payoffs in the
distressed assets portfolio.
Loans represented 57% of total assets at December 31, 2010
and 58% at December 31, 2009. Commercial lending
represented 53% of the loan portfolio and consumer lending
represented 47% at both December 31, 2010 and
December 31, 2009.
Commercial real estate loans represented 7% of total assets at
December 31, 2010 and 9% of total assets at December 31,
2009.
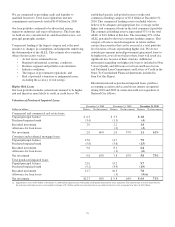
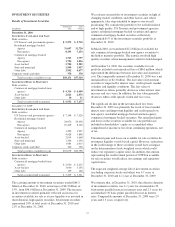
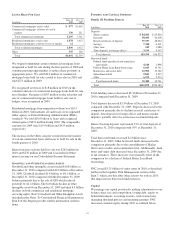
Details Of Loans
In millions
Dec. 31
2010
Dec. 31
2009
Commercial
Retail/wholesale $ 9,901 $ 9,515
Manufacturing 9,334 9,880
Service providers 8,866 8,256
Real estate related (a) 7,500 7,403
Financial services 4,573 3,874
Health care 3,481 2,970
Other 11,522 12,920
Total commercial 55,177 54,818
Commercial real estate
Real estate projects 12,211 15,582
Commercial mortgage 5,723 7,549
Total commercial real estate 17,934 23,131
Equipment lease financing 6,393 6,202
TOTAL COMMERCIAL LENDING (b) 79,504 84,151
Consumer
Home equity
Lines of credit 23,473 24,236
Installment 10,753 11,711
Residential real estate
Residential mortgage 15,292 18,190
Residential construction 707 1,620
Credit card 3,920 2,569
Education 9,196 7,468
Automobile 2,983 2,013
Other 4,767 5,585
TOTAL CONSUMER LENDING 71,091 73,392
Total loans $150,595 $157,543
(a) Includes loans to customers in the real estate and construction industries.
(b) Construction loans with interest reserves and A Note/B Note restructurings are not
significant to PNC.
Total loans above include purchased impaired loans of
$7.8 billion, or 5% of total loans, at December 31, 2010, and
$10.3 billion, or 7% of total loans, at December 31, 2009.
34