PNC Bank 2010 Annual Report Download - page 56
Download and view the complete annual report
Please find page 56 of the 2010 PNC Bank annual report below. You can navigate through the pages in the report by either clicking on the pages listed below, or by using the keyword search tool below to find specific information within the annual report.-
 1
1 -
2
-
3
-
4
-
5
-
6
-
7
-
8
-
9
-
10
-
11
-
12
-
13
-
14
-
15
-
16
-
17
-
18
-
19
-
20
-
21
-
22
-
23
-
24
-
25
-
26
-
27
-
28
-
29
-
30
-
31
-
32
-
33
-
34
-
35
-
36
-
37
-
38
-
39
-
40
-
41
-
42
-
43
-
44
-
45
-
 46
46 -
 47
47 -
 48
48 -
 49
49 -
 50
50 -
 51
51 -
 52
52 -
 53
53 -
 54
54 -
 55
55 -
 56
56 -
 57
57 -
 58
58 -
 59
59 -
 60
60 -
 61
61 -
 62
62 -
 63
63 -
 64
64 -
 65
65 -
 66
66 -
67
-
68
-
69
-
70
-
71
-
72
-
73
-
74
-
75
-
76
-
77
-
78
-
79
-
80
-
81
-
82
-
83
-
84
-
85
-
86
-
87
-
88
-
89
-
90
-
91
-
92
-
93
-
94
-
95
-
96
-
97
-
98
-
99
-
100
-
101
-
102
-
103
-
104
-
105
-
106
-
107
-
108
-
109
-
110
-
111
-
112
-
113
-
114
-
115
-
116
-
117
-
118
-
119
-
120
-
121
-
122
-
123
-
124
-
125
-
126
-
127
-
128
-
129
-
130
-
131
-
132
-
133
-
134
-
135
-
136
-
137
-
138
-
139
-
140
-
141
-
142
-
143
-
144
-
145
-
146
-
147
-
148
-
149
-
150
-
151
-
152
-
153
-
154
-
155
-
156
-
157
-
158
-
159
-
160
-
161
-
162
-
163
-
164
-
165
-
166
-
167
-
168
-
169
-
170
-
171
-
172
-
173
-
174
-
175
-
176
-
177
-
178
-
179
-
180
-
181
-
182
-
183
-
184
-
185
-
186
-
187
-
188
-
189
-
190
-
191
-
192
-
193
-
194
-
195
-
196
-
197
-
198
-
199
-
200
-
201
-
202
-
203
-
204
-
205
-
206
-
207
-
208
-
209
-
210
-
211
-
212
-
213
-
214
 |
 |

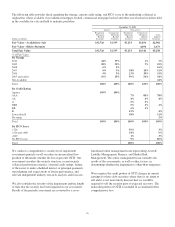
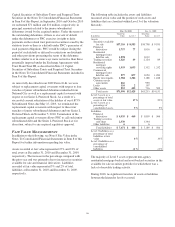
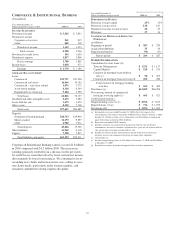
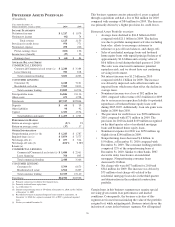
Results Of Businesses – Summary
(Unaudited)
Income (Loss) Revenue Average Assets (a)
Year ended December 31- in millions 2010 2009 2010 2009 2010 2009
Retail Banking (b) $ 140 $ 136 $ 5,376 $ 5,721 $ 67,024 $ 65,320
Corporate & Institutional Banking 1,770 1,190 4,908 5,266 77,467 84,689
Asset Management Group 141 105 890 919 7,022 7,320
Residential Mortgage Banking 275 435 1,003 1,328 9,247 8,420
BlackRock 351 207 462 262 5,428 6,249
Distressed Assets Portfolio (64) 84 1,125 1,153 17,517 22,844
Total business segments 2,613 2,157 13,764 14,649 183,705 194,842
Other (b) (c) (d) 411 201 1,412 1,579 81,197 82,034
Income from continuing operations before
noncontrolling interests (e) $3,024 $2,358 $15,176 $16,228 $264,902 $276,876
(a) Period-end balances for BlackRock.
(b) Amounts for 2009 include the results of the 61 branches prior to their divestiture in early September 2009.
(c) For our segment reporting presentation in this Financial Review, “Other” earnings and revenue for 2010 include a $102 million after-tax ($160 million pretax) gain related to our gain
on the sale of a portion of our investment in BlackRock stock as part of a BlackRock secondary common stock offering in November 2010 and “Other” earnings for 2010 also includes
$251 million of after-tax ($387 million pretax) integration costs primarily related to National City. “Other” earnings and revenue for 2009 include a $687 million after-tax ($1.076
billion pretax) gain related to the BlackRock/BGI transaction and “Other” earnings for 2009 also includes $274 million of after-tax ($421 million pretax) integration costs primarily
related to National City.
(d) “Other” average assets include investment securities associated with asset and liability management activities.
(e) Amounts are presented on a continuing operations basis and therefore exclude the earnings, revenue, and assets of GIS, including the third quarter 2010 gain on sale of GIS.
48