PNC Bank 2010 Annual Report Download - page 45
Download and view the complete annual report
Please find page 45 of the 2010 PNC Bank annual report below. You can navigate through the pages in the report by either clicking on the pages listed below, or by using the keyword search tool below to find specific information within the annual report.-
 1
1 -
2
-
3
-
4
-
5
-
6
-
7
-
8
-
9
-
10
-
11
-
12
-
13
-
14
-
15
-
16
-
17
-
18
-
19
-
20
-
21
-
22
-
23
-
24
-
25
-
26
-
27
-
28
-
29
-
30
-
31
-
32
-
33
-
34
-
 35
35 -
 36
36 -
 37
37 -
 38
38 -
 39
39 -
 40
40 -
 41
41 -
 42
42 -
 43
43 -
 44
44 -
 45
45 -
 46
46 -
 47
47 -
 48
48 -
 49
49 -
 50
50 -
 51
51 -
 52
52 -
 53
53 -
 54
54 -
 55
55 -
56
-
57
-
58
-
59
-
60
-
61
-
62
-
63
-
64
-
65
-
66
-
67
-
68
-
69
-
70
-
71
-
72
-
73
-
74
-
75
-
76
-
77
-
78
-
79
-
80
-
81
-
82
-
83
-
84
-
85
-
86
-
87
-
88
-
89
-
90
-
91
-
92
-
93
-
94
-
95
-
96
-
97
-
98
-
99
-
100
-
101
-
102
-
103
-
104
-
105
-
106
-
107
-
108
-
109
-
110
-
111
-
112
-
113
-
114
-
115
-
116
-
117
-
118
-
119
-
120
-
121
-
122
-
123
-
124
-
125
-
126
-
127
-
128
-
129
-
130
-
131
-
132
-
133
-
134
-
135
-
136
-
137
-
138
-
139
-
140
-
141
-
142
-
143
-
144
-
145
-
146
-
147
-
148
-
149
-
150
-
151
-
152
-
153
-
154
-
155
-
156
-
157
-
158
-
159
-
160
-
161
-
162
-
163
-
164
-
165
-
166
-
167
-
168
-
169
-
170
-
171
-
172
-
173
-
174
-
175
-
176
-
177
-
178
-
179
-
180
-
181
-
182
-
183
-
184
-
185
-
186
-
187
-
188
-
189
-
190
-
191
-
192
-
193
-
194
-
195
-
196
-
197
-
198
-
199
-
200
-
201
-
202
-
203
-
204
-
205
-
206
-
207
-
208
-
209
-
210
-
211
-
212
-
213
-
214
 |
 |

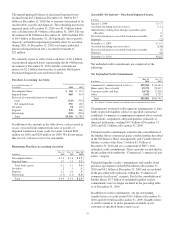
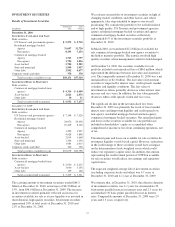
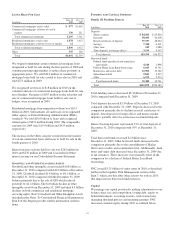
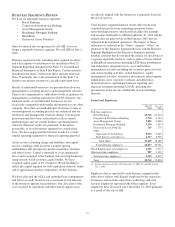
INVESTMENT SECURITIES
Details of Investment Securities
In millions
Amortized
Cost
Fair
Value
December 31, 2010
S
ECURITIES
A
VAILABLE FOR
S
ALE
Debt securities
US Treasury and government agencies $ 5,575 $ 5,710
Residential mortgage-backed
Agency 31,697 31,720
Non-agency 8,193 7,233
Commercial mortgage-backed
Agency 1,763 1,797
Non-agency 1,794 1,856
Asset-backed 2,780 2,582
State and municipal 1,999 1,957
Other debt 3,992 4,077
Corporate stocks and other 378 378
Total securities available for sale $58,171 $57,310
S
ECURITIES
H
ELD TO
M
ATURITY
Debt securities
Commercial mortgage-backed (non-
agency) $ 4,316 $ 4,490
Asset-backed 2,626 2,676
Other debt 10 11
Total securities held to maturity $ 6,952 $ 7,177
December 31, 2009
S
ECURITIES
A
VAILABLE FOR
S
ALE
Debt securities
US Treasury and government agencies $ 7,548 $ 7,520
Residential mortgage-backed
Agency 24,076 24,438
Non-agency 10,419 8,302
Commercial mortgage-backed
Agency 1,299 1,297
Non-agency 4,028 3,848
Asset-backed 2,019 1,668
State and municipal 1,346 1,350
Other debt 1,984 2,015
Corporate stocks and other 360 360
Total securities available for sale $53,079 $50,798
S
ECURITIES
H
ELD TO
M
ATURITY
Debt securities
Commercial mortgage-backed (non-
agency) $ 2,030 $ 2,225
Asset-backed 3,040 3,136
Other debt 159 160
Total securities held to maturity $ 5,229 $ 5,521
The carrying amount of investment securities totaled $64.3
billion at December 31, 2010, an increase of $8.3 billion, or
15%, from $56.0 billion at December 31, 2009. The increase
in investment securities primarily reflected an increase in
securities available for sale as excess liquidity was invested in
short duration, high quality securities. Investment securities
represented 24% of total assets at December 31, 2010 and
21% at December 31, 2009.
We evaluate our portfolio of investment securities in light of
changing market conditions and other factors and, where
appropriate, take steps intended to improve our overall
positioning. We consider the portfolio to be well-diversified
and of high quality. US Treasury and government agencies,
agency residential mortgage-backed securities and agency
commercial mortgage-backed securities collectively
represented 61% of the investment securities portfolio at
December 31, 2010.
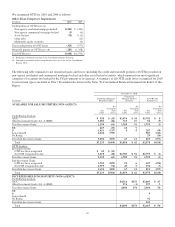
In March 2010, we transferred $2.2 billion of available for
sale commercial mortgage-backed non-agency securities to
the held to maturity portfolio. The transfer involved high
quality securities where management’s intent to hold changed.
At December 31, 2010, the securities available for sale
portfolio included a net unrealized loss of $861 million, which
represented the difference between fair value and amortized
cost. The comparable amount at December 31, 2009 was a net
unrealized loss of $2.3 billion. The fair value of investment
securities is impacted by interest rates, credit spreads, market
volatility and liquidity conditions. The fair value of
investment securities generally decreases when interest rates
increase and vice versa. In addition, the fair value generally
decreases when credit spreads widen and vice versa.
The significant decline in the net unrealized loss from
December 31, 2009 was primarily the result of lower market
interest rates and improving liquidity and credit spreads on
non-agency residential mortgage-backed and non-agency
commercial mortgage-backed securities. Net unrealized gains
and losses in the securities available for sale portfolio are
included in shareholders’ equity as accumulated other
comprehensive income or loss from continuing operations, net
of tax.
Unrealized gains and losses on available for sale securities do
not impact liquidity or risk-based capital. However, reductions
in the credit ratings of these securities would have an impact
on the determination of risk-weighted assets which could
reduce our regulatory capital ratios. In addition, the amount
representing the credit-related portion of OTTI on available
for sale securities would reduce our earnings and regulatory
capital ratios.
The expected weighted-average life of investment securities
(excluding corporate stocks and other) was 4.7 years at
December 31, 2010 and 4.1 years at December 31, 2009.
We estimate that, at December 31, 2010, the effective duration
of investment securities was 3.1 years for an immediate 50
basis points parallel increase in interest rates and 2.9 years for
an immediate 50 basis points parallel decrease in interest
rates. Comparable amounts at December 31, 2009 were 2.9
years and 2.5 years, respectively.
37