PNC Bank 2010 Annual Report Download - page 174
Download and view the complete annual report
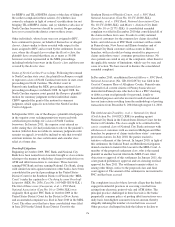
Please find page 174 of the 2010 PNC Bank annual report below. You can navigate through the pages in the report by either clicking on the pages listed below, or by using the keyword search tool below to find specific information within the annual report.-
 1
1 -
2
-
3
-
4
-
5
-
6
-
7
-
8
-
9
-
10
-
11
-
12
-
13
-
14
-
15
-
16
-
17
-
18
-
19
-
20
-
21
-
22
-
23
-
24
-
25
-
26
-
27
-
28
-
29
-
30
-
31
-
32
-
33
-
34
-
35
-
36
-
37
-
38
-
39
-
40
-
41
-
42
-
43
-
44
-
45
-
46
-
47
-
48
-
49
-
50
-
51
-
52
-
53
-
54
-
55
-
56
-
57
-
58
-
59
-
60
-
61
-
62
-
63
-
64
-
65
-
66
-
67
-
68
-
69
-
70
-
71
-
72
-
73
-
74
-
75
-
76
-
77
-
78
-
79
-
80
-
81
-
82
-
83
-
84
-
85
-
86
-
87
-
88
-
89
-
90
-
91
-
92
-
93
-
94
-
95
-
96
-
97
-
98
-
99
-
100
-
101
-
102
-
103
-
104
-
105
-
106
-
107
-
108
-
109
-
110
-
111
-
112
-
113
-
114
-
115
-
116
-
117
-
118
-
119
-
120
-
121
-
122
-
123
-
124
-
125
-
126
-
127
-
128
-
129
-
130
-
131
-
132
-
133
-
134
-
135
-
136
-
137
-
138
-
139
-
140
-
141
-
142
-
143
-
144
-
145
-
146
-
147
-
148
-
149
-
150
-
151
-
152
-
153
-
154
-
155
-
156
-
157
-
158
-
159
-
160
-
161
-
162
-
163
-
 164
164 -
 165
165 -
 166
166 -
 167
167 -
 168
168 -
 169
169 -
 170
170 -
 171
171 -
 172
172 -
 173
173 -
 174
174 -
 175
175 -
 176
176 -
 177
177 -
 178
178 -
 179
179 -
 180
180 -
 181
181 -
 182
182 -
 183
183 -
 184
184 -
185
-
186
-
187
-
188
-
189
-
190
-
191
-
192
-
193
-
194
-
195
-
196
-
197
-
198
-
199
-
200
-
201
-
202
-
203
-
204
-
205
-
206
-
207
-
208
-
209
-
210
-
211
-
212
-
213
-
214
 |
 |

N
OTE
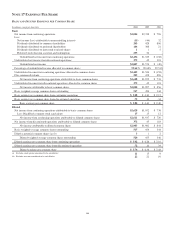
17 E
ARNINGS
P
ER
S
HARE
B
ASIC AND
D
ILUTED
E
ARNINGS PER
C
OMMON
S
HARE
In millions, except per share data 2010 2009 2008
Basic
Net income from continuing operations $3,024 $2,358 $ 796
Less:
Net income (loss) attributable to noncontrolling interests (15) (44) 32
Dividends distributed to common shareholders 203 428 896
Dividends distributed to preferred shareholders 146 388 21
Dividends distributed to nonvested restricted shares 115
Preferred stock discount accretion and redemptions 255 56
Undistributed net income from continuing operations $2,434 $1,529 $ (158)
Undistributed net income from discontinued operations 373 45 118
Undistributed net income $2,807 $1,574 $ (40)
Percentage of undistributed income allocated to common shares 99.64% 99.68% 99.51%
Undistributed income from continuing operations allocated to common shares $2,425 $1,524 $ (158)
Plus common dividends 203 428 896
Net income from continuing operations attributable to basic common shares $2,628 $1,952 $ 738
Undistributed income from discontinued operations allocated to common shares 372 45 118
Net income attributable to basic common shares $3,000 $1,997 $ 856
Basic weighted-average common shares outstanding 517 454 344
Basic earnings per common share from continuing operations $ 5.08 $ 4.30 $ 2.15
Basic earnings per common share from discontinued operations .72 .10 .34
Basic earnings per common share $ 5.80 $ 4.40 $ 2.49
Diluted
Net income from continuing operations attributable to basic common shares $2,628 $1,952 $ 738
Less: BlackRock common stock equivalents 17 15 12
Net income from continuing operations attributable to diluted common shares $2,611 $1,937 $ 726
Net income from discontinued operations attributable to diluted common shares 372 45 118
Net income attributable to diluted common shares $2,983 $1,982 $ 844
Basic weighted-average common shares outstanding 517 454 344
Dilutive potential common shares (a) (b) 312
Diluted weighted-average common shares outstanding 520 455 346
Diluted earnings per common share from continuing operations $ 5.02 $ 4.26 $ 2.10
Diluted earnings per common share from discontinued operations .72 .10 .34
Diluted earnings per common share $ 5.74 $ 4.36 $ 2.44
(a) Excludes stock options considered to be anti-dilutive 11 15 9
(b) Excludes warrants considered to be anti-dilutive 22 22 19
166