PNC Bank 2010 Annual Report Download - page 144
Download and view the complete annual report
Please find page 144 of the 2010 PNC Bank annual report below. You can navigate through the pages in the report by either clicking on the pages listed below, or by using the keyword search tool below to find specific information within the annual report.-
 1
1 -
2
-
3
-
4
-
5
-
6
-
7
-
8
-
9
-
10
-
11
-
12
-
13
-
14
-
15
-
16
-
17
-
18
-
19
-
20
-
21
-
22
-
23
-
24
-
25
-
26
-
27
-
28
-
29
-
30
-
31
-
32
-
33
-
34
-
35
-
36
-
37
-
38
-
39
-
40
-
41
-
42
-
43
-
44
-
45
-
46
-
47
-
48
-
49
-
50
-
51
-
52
-
53
-
54
-
55
-
56
-
57
-
58
-
59
-
60
-
61
-
62
-
63
-
64
-
65
-
66
-
67
-
68
-
69
-
70
-
71
-
72
-
73
-
74
-
75
-
76
-
77
-
78
-
79
-
80
-
81
-
82
-
83
-
84
-
85
-
86
-
87
-
88
-
89
-
90
-
91
-
92
-
93
-
94
-
95
-
96
-
97
-
98
-
99
-
100
-
101
-
102
-
103
-
104
-
105
-
106
-
107
-
108
-
109
-
110
-
111
-
112
-
113
-
114
-
115
-
116
-
117
-
118
-
119
-
120
-
121
-
122
-
123
-
124
-
125
-
126
-
127
-
128
-
129
-
130
-
131
-
132
-
133
-
 134
134 -
 135
135 -
 136
136 -
 137
137 -
 138
138 -
 139
139 -
 140
140 -
 141
141 -
 142
142 -
 143
143 -
 144
144 -
 145
145 -
 146
146 -
 147
147 -
 148
148 -
 149
149 -
 150
150 -
 151
151 -
 152
152 -
 153
153 -
 154
154 -
155
-
156
-
157
-
158
-
159
-
160
-
161
-
162
-
163
-
164
-
165
-
166
-
167
-
168
-
169
-
170
-
171
-
172
-
173
-
174
-
175
-
176
-
177
-
178
-
179
-
180
-
181
-
182
-
183
-
184
-
185
-
186
-
187
-
188
-
189
-
190
-
191
-
192
-
193
-
194
-
195
-
196
-
197
-
198
-
199
-
200
-
201
-
202
-
203
-
204
-
205
-
206
-
207
-
208
-
209
-
210
-
211
-
212
-
213
-
214
 |
 |

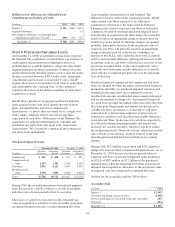
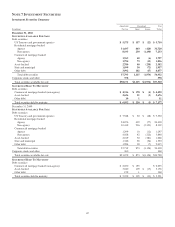
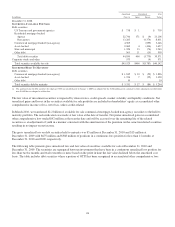
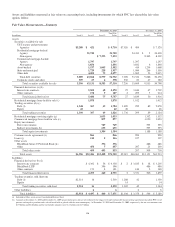
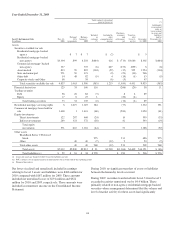
Assets and liabilities measured at fair value on a recurring basis, including instruments for which PNC has elected the fair value
option, follow.
Fair Value Measurements—Summary
December 31, 2010 December 31, 2009
In millions Level 1 Level 2 Level 3
Total Fair
Value Level 1 Level 2 Level 3
Total Fair
Value
Assets
Securities available for sale
US Treasury and government
Agencies $5,289 $ 421 $ 5,710 $7,026 $ 494 $ 7,520
Residential mortgage-backed
Agency 31,720 31,720 24,433 $ 5 24,438
Non-agency $ 7,233 7,233 8,302 8,302
Commercial mortgage-backed
Agency 1,797 1,797 1,297 1,297
Non-agency 1,856 1,856 3,842 6 3,848
Asset-backed 1,537 1,045 2,582 414 1,254 1,668
State and municipal 1,729 228 1,957 1,084 266 1,350
Other debt 4,004 73 4,077 1,962 53 2,015
Total debt securities 5,289 43,064 8,579 56,932 7,026 33,526 9,886 50,438
Corporate stocks and other 307 67 4 378 230 83 47 360
Total securities available for sale 5,596 43,131 8,583 57,310 7,256 33,609 9,933 50,798
Financial derivatives (a) (b)
Interest rate contracts 5,502 68 5,570 25 3,630 47 3,702
Other contracts 178 9 187 2 209 3 214
Total financial derivatives 5,680 77 5,757 27 3,839 50 3,916
Residential mortgage loans held for sale (c) 1,878 1,878 1,012 1,012
Trading securities (d) (e)
Debt (f) 1,348 367 69 1,784 1,690 299 89 2,078
Equity 42 42 46 46
Total trading securities 1,390 367 69 1,826 1,736 299 89 2,124
Residential mortgage servicing rights (g) 1,033 1,033 1,332 1,332
Commercial mortgage loans held for sale (c) 877 877 1,050 1,050
Equity investments
Direct investments 749 749 595 595
Indirect investments (h) 635 635 593 593
Total equity investments 1,384 1,384 1,188 1,188
Customer resale agreements (i) 866 866 990 990
Loans (j) 114 2 116 107 107
Other assets
BlackRock Series C Preferred Stock (k) 396 396 486 486
Other 450 7 457 207 23 230
Total other assets 450 403 853 207 509 716
Total assets $6,986 $52,486 $12,428 $71,900 $9,019 $40,063 $14,151 $63,233
Liabilities
Financial derivatives (b) (l)
Interest rate contracts $ 4,302 $ 56 $ 4,358 $ 2 $ 3,185 $ 18 $ 3,205
BlackRock LTIP 396 396 486 486
Other contracts 173 8 181 146 2 148
Total financial derivatives 4,475 460 4,935 2 3,331 506 3,839
Trading securities sold short (m)
Debt (f) $2,514 16 2,530 1,288 42 1,330
Equity 14 14
Total trading securities sold short 2,514 16 2,530 1,302 42 1,344
Other liabilities 6666
Total liabilities $2,514 $ 4,497 $ 460 $ 7,471 $1,304 $ 3,379 $ 506 $ 5,189
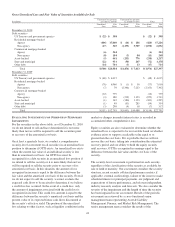
(a) Included in Other assets on our Consolidated Balance Sheet.
(b) Amounts at December 31, 2010 and December 31, 2009 are presented gross and are not reduced by the impact of legally enforceable master netting agreements that allow PNC to net
positive and negative positions and cash collateral held or placed with the same counterparty. At December 31, 2010 and December 31, 2009, respectively, the net asset amounts were
$1.9 billion and $2.0 billion and the net liability amounts were $1.1 billion and $1.7 billion.
136