PNC Bank 2010 Annual Report Download - page 107
Download and view the complete annual report
Please find page 107 of the 2010 PNC Bank annual report below. You can navigate through the pages in the report by either clicking on the pages listed below, or by using the keyword search tool below to find specific information within the annual report.-
 1
1 -
2
-
3
-
4
-
5
-
6
-
7
-
8
-
9
-
10
-
11
-
12
-
13
-
14
-
15
-
16
-
17
-
18
-
19
-
20
-
21
-
22
-
23
-
24
-
25
-
26
-
27
-
28
-
29
-
30
-
31
-
32
-
33
-
34
-
35
-
36
-
37
-
38
-
39
-
40
-
41
-
42
-
43
-
44
-
45
-
46
-
47
-
48
-
49
-
50
-
51
-
52
-
53
-
54
-
55
-
56
-
57
-
58
-
59
-
60
-
61
-
62
-
63
-
64
-
65
-
66
-
67
-
68
-
69
-
70
-
71
-
72
-
73
-
74
-
75
-
76
-
77
-
78
-
79
-
80
-
81
-
82
-
83
-
84
-
85
-
86
-
87
-
88
-
89
-
90
-
91
-
92
-
93
-
94
-
95
-
96
-
 97
97 -
 98
98 -
 99
99 -
 100
100 -
 101
101 -
 102
102 -
 103
103 -
 104
104 -
 105
105 -
 106
106 -
 107
107 -
 108
108 -
 109
109 -
 110
110 -
 111
111 -
 112
112 -
 113
113 -
 114
114 -
 115
115 -
 116
116 -
 117
117 -
118
-
119
-
120
-
121
-
122
-
123
-
124
-
125
-
126
-
127
-
128
-
129
-
130
-
131
-
132
-
133
-
134
-
135
-
136
-
137
-
138
-
139
-
140
-
141
-
142
-
143
-
144
-
145
-
146
-
147
-
148
-
149
-
150
-
151
-
152
-
153
-
154
-
155
-
156
-
157
-
158
-
159
-
160
-
161
-
162
-
163
-
164
-
165
-
166
-
167
-
168
-
169
-
170
-
171
-
172
-
173
-
174
-
175
-
176
-
177
-
178
-
179
-
180
-
181
-
182
-
183
-
184
-
185
-
186
-
187
-
188
-
189
-
190
-
191
-
192
-
193
-
194
-
195
-
196
-
197
-
198
-
199
-
200
-
201
-
202
-
203
-
204
-
205
-
206
-
207
-
208
-
209
-
210
-
211
-
212
-
213
-
214
 |
 |

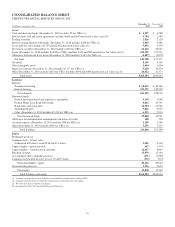
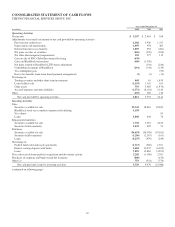
CONSOLIDATED STATEMENT OF CASH FLOWS
THE PNC FINANCIAL SERVICES GROUP, INC.
Year ended December 31
In millions 2010 2009 2008
Operating Activities
Net income $ 3,397 $ 2,403 $ 914
Adjustments to reconcile net income to net cash provided by operating activities
Provision for credit losses 2,502 3,930 1,517
Depreciation and amortization 1,059 978 463
Deferred income taxes (benefit) 1,019 932 (261)
Net gains on sales of securities (426) (550) (106)
Net other-than-temporary impairments 325 577 312
Gain on sale of PNC Global Investment Servicing (639)
Gains on BlackRock transactions (160) (1,076)
Net gains related to BlackRock LTIP shares adjustment (103) (246)
Undistributed earnings of BlackRock (291) (144) (129)
Visa redemption gain (95)
Excess tax benefits from share-based payment arrangements (1) (1) (13)
Net change in
Trading securities and other short-term investments 468 61 1,459
Loans held for sale (1,154) 1,110 303
Other assets 753 5,485 (1,974)
Accrued expenses and other liabilities (1,571) (8,118) 5,140
Other (470) 269 130
Net cash provided by operating activities 4,811 5,753 7,414
Investing Activities
Sales
Securities available for sale 23,343 18,861 10,283
BlackRock stock via secondary common stock offering 1,198
Visa shares 95
Loans 1,868 644 76
Repayments/maturities
Securities available for sale 7,730 7,291 4,225
Securities held to maturity 2,433 495 21
Purchases
Securities available for sale (36,653) (34,078) (19,381)
Securities held to maturity (1,296) (2,367) (101)
Loans (4,275) (970) (249)
Net change in
Federal funds sold and resale agreements (1,313) (560) 1,301
Interest-earning deposits with banks 2,684 10,237 (6,302)
Loans 7,855 13,863 (4,595)
Net cash received from (paid for) acquisition and divestiture activity 2,202 (3,396) 2,761
Purchases of corporate and bank-owned life insurance (800) (350)
Other (a) 753 (541) (770)
Net cash provided (used) by investing activities 5,729 9,479 (12,986)
(continued on following page)
99