PNC Bank 2010 Annual Report Download - page 78
Download and view the complete annual report
Please find page 78 of the 2010 PNC Bank annual report below. You can navigate through the pages in the report by either clicking on the pages listed below, or by using the keyword search tool below to find specific information within the annual report.-
 1
1 -
2
-
3
-
4
-
5
-
6
-
7
-
8
-
9
-
10
-
11
-
12
-
13
-
14
-
15
-
16
-
17
-
18
-
19
-
20
-
21
-
22
-
23
-
24
-
25
-
26
-
27
-
28
-
29
-
30
-
31
-
32
-
33
-
34
-
35
-
36
-
37
-
38
-
39
-
40
-
41
-
42
-
43
-
44
-
45
-
46
-
47
-
48
-
49
-
50
-
51
-
52
-
53
-
54
-
55
-
56
-
57
-
58
-
59
-
60
-
61
-
62
-
63
-
64
-
65
-
66
-
67
-
 68
68 -
 69
69 -
 70
70 -
 71
71 -
 72
72 -
 73
73 -
 74
74 -
 75
75 -
 76
76 -
 77
77 -
 78
78 -
 79
79 -
 80
80 -
 81
81 -
 82
82 -
 83
83 -
 84
84 -
 85
85 -
 86
86 -
 87
87 -
 88
88 -
89
-
90
-
91
-
92
-
93
-
94
-
95
-
96
-
97
-
98
-
99
-
100
-
101
-
102
-
103
-
104
-
105
-
106
-
107
-
108
-
109
-
110
-
111
-
112
-
113
-
114
-
115
-
116
-
117
-
118
-
119
-
120
-
121
-
122
-
123
-
124
-
125
-
126
-
127
-
128
-
129
-
130
-
131
-
132
-
133
-
134
-
135
-
136
-
137
-
138
-
139
-
140
-
141
-
142
-
143
-
144
-
145
-
146
-
147
-
148
-
149
-
150
-
151
-
152
-
153
-
154
-
155
-
156
-
157
-
158
-
159
-
160
-
161
-
162
-
163
-
164
-
165
-
166
-
167
-
168
-
169
-
170
-
171
-
172
-
173
-
174
-
175
-
176
-
177
-
178
-
179
-
180
-
181
-
182
-
183
-
184
-
185
-
186
-
187
-
188
-
189
-
190
-
191
-
192
-
193
-
194
-
195
-
196
-
197
-
198
-
199
-
200
-
201
-
202
-
203
-
204
-
205
-
206
-
207
-
208
-
209
-
210
-
211
-
212
-
213
-
214
 |
 |

expected cash flows on the loans at the measurement date over
the recorded investment. Any decrease, other than for
prepayments or interest rate decreases for variable rate notes,
in the net present value of expected cash flows of individual
commercial or pooled consumer purchased impaired loans
would result in an impairment charge to the provision for loan
losses in the period in which the change is deemed probable.
Any increase in the net present value of expected cash flows
of purchased impaired loans would first result in a recovery of
previously recorded allowance for loan losses, to the extent
applicable, and then an increase to accretable yield for the
remaining life of the purchased impaired loans. See Note 6
Purchased Impaired Loans in the Notes To Consolidated
Financial Statements in Item 8 of this Report for additional
information.
Additionally, most consumer loans and lines of credit, not
secured by residential real estate, are charged off after 120 to
180 days past due, are not placed on nonaccrual status, and are
excluded from nonperforming loans.
The amount of nonperforming loans that was current as to
remaining principal and interest was $1.0 billion at
December 31, 2010 and $1.7 billion at December 31, 2009, or
22% and 30% of total nonperforming loans, respectively.
The portion of the ALLL allocated to commercial lending
nonperforming loans was 28% at December 31, 2010 and 29%
at December 31, 2009. Approximately 76% of total
nonperforming loans are secured by collateral that is expected
to reduce credit losses and require less reserves in the event of
default.
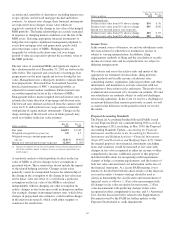
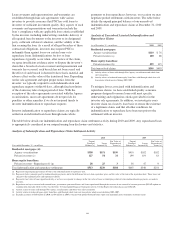
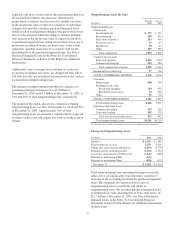
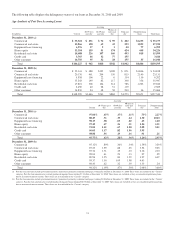
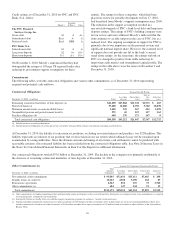
Nonperforming Assets By Type
In millions
Dec. 31
2010
Dec. 31
2009
Nonperforming loans
Commercial
Retail/wholesale $ 197 $ 231
Manufacturing 250 423
Real estate related (a) 263 419
Financial services 16 117
Health care 50 41
Other 477 575
Total commercial 1,253 1,806
Commercial real estate
Real estate projects 1,422 1,754
Commercial mortgage 413 386
Total commercial real estate 1,835 2,140
Equipment lease financing 77 130
TOTAL COMMERCIAL LENDING 3,165 4,076
Consumer
Home equity 448 356
Residential real estate
Residential mortgage 764 955
Residential construction 54 248
Other 35 36
TOTAL CONSUMER LENDING 1,301 1,595
Total nonperforming loans 4,466 5,671
Foreclosed and other assets
Commercial lending 353 266
Consumer lending 482 379
Total foreclosed and other assets 835 645
Total nonperforming assets $5,301 $6,316
(a) Includes loans related to customers in the real estate and construction industries.
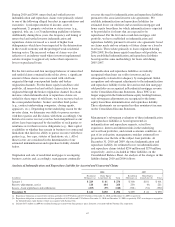
Change In Nonperforming Assets
In millions 2010 2009
January 1 $ 6,316 $ 2,181
Transferred from accrual 5,279 8,501
Charge-offs and valuation adjustments (2,071) (1,770)
Principal activity including payoffs (1,316) (1,127)
Asset sales and transfers to held for sale (1,446) (798)
Returned to performing-TDRs (543)
Returned to performing-Other (918) (671)
December 31 $ 5,301 $ 6,316
Total nonperforming loans and nonperforming assets in the
tables above are significantly lower than they would have
been due to the accounting treatment for purchased impaired
loans. This treatment also results in lower ratios of
nonperforming loans to total loans and ALLL to
nonperforming loans. We recorded purchased impaired loans
at estimated fair value, including life of loan credit losses, of
$12.7 billion at December 31, 2008. See Note 6 Purchased
Impaired Loans in the Notes To Consolidated Financial
Statements in Item 8 of this Report for additional information
on those loans.
70