PNC Bank 2010 Annual Report Download - page 52
Download and view the complete annual report
Please find page 52 of the 2010 PNC Bank annual report below. You can navigate through the pages in the report by either clicking on the pages listed below, or by using the keyword search tool below to find specific information within the annual report.-
 1
1 -
2
-
3
-
4
-
5
-
6
-
7
-
8
-
9
-
10
-
11
-
12
-
13
-
14
-
15
-
16
-
17
-
18
-
19
-
20
-
21
-
22
-
23
-
24
-
25
-
26
-
27
-
28
-
29
-
30
-
31
-
32
-
33
-
34
-
35
-
36
-
37
-
38
-
39
-
40
-
41
-
 42
42 -
 43
43 -
 44
44 -
 45
45 -
 46
46 -
 47
47 -
 48
48 -
 49
49 -
 50
50 -
 51
51 -
 52
52 -
 53
53 -
 54
54 -
 55
55 -
 56
56 -
 57
57 -
 58
58 -
 59
59 -
 60
60 -
 61
61 -
 62
62 -
63
-
64
-
65
-
66
-
67
-
68
-
69
-
70
-
71
-
72
-
73
-
74
-
75
-
76
-
77
-
78
-
79
-
80
-
81
-
82
-
83
-
84
-
85
-
86
-
87
-
88
-
89
-
90
-
91
-
92
-
93
-
94
-
95
-
96
-
97
-
98
-
99
-
100
-
101
-
102
-
103
-
104
-
105
-
106
-
107
-
108
-
109
-
110
-
111
-
112
-
113
-
114
-
115
-
116
-
117
-
118
-
119
-
120
-
121
-
122
-
123
-
124
-
125
-
126
-
127
-
128
-
129
-
130
-
131
-
132
-
133
-
134
-
135
-
136
-
137
-
138
-
139
-
140
-
141
-
142
-
143
-
144
-
145
-
146
-
147
-
148
-
149
-
150
-
151
-
152
-
153
-
154
-
155
-
156
-
157
-
158
-
159
-
160
-
161
-
162
-
163
-
164
-
165
-
166
-
167
-
168
-
169
-
170
-
171
-
172
-
173
-
174
-
175
-
176
-
177
-
178
-
179
-
180
-
181
-
182
-
183
-
184
-
185
-
186
-
187
-
188
-
189
-
190
-
191
-
192
-
193
-
194
-
195
-
196
-
197
-
198
-
199
-
200
-
201
-
202
-
203
-
204
-
205
-
206
-
207
-
208
-
209
-
210
-
211
-
212
-
213
-
214
 |
 |

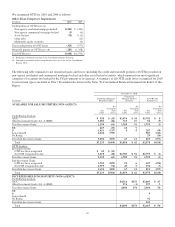
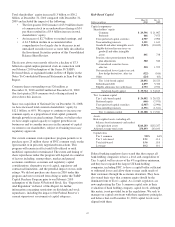
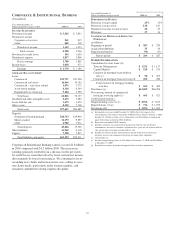
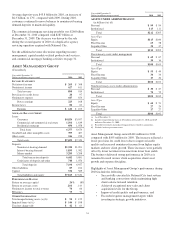
The following provides a summary of VIEs, including those that we have consolidated and those in which we hold variable
interests but have not consolidated into our financial statements, as of December 31, 2010 and December 31, 2009, respectively.
Consolidated VIEs – Carrying Value (a)
December 31, 2010
In millions
Market
Street
Credit Card
Securitization Trust
Tax Credit
Investments (b) Total
Assets
Cash and due from banks $2 $2
Interest-earning deposits with banks $ 284 4 288
Investment securities $ 192 192
Loans 2,520 2,125 4,645
Allowance for loan and lease losses (183) (183)
Equity investments 1,177 1,177
Other assets 271 9 396 676
Total assets $2,983 $2,235 $1,579 $6,797
Liabilities
Other borrowed funds $2,715 $ 523 $ 116 $3,354
Accrued expenses 97988
Other liabilities 268 188 456
Total liabilities $2,983 $ 532 $ 383 $3,898
(a) Amounts represent carrying value on PNC’s Consolidated Balance Sheet.
(b) Amounts reported primarily represent LIHTC investments.
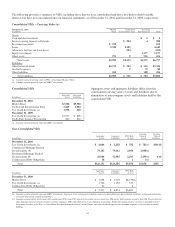
Consolidated VIEs
In millions
Aggregate
Assets
Aggregate
Liabilities
December 31, 2010
Market Street $3,584 $3,588
Credit Card Securitization Trust 2,269 1,004
Tax Credit Investments (a) 1,590 420
December 31, 2009
Tax Credit Investments (a) $1,933 $ 808
Credit Risk Transfer Transaction 860 860
(a) Amounts reported primarily represent LIHTC investments.
Aggregate assets and aggregate liabilities differ from the
consolidated carrying value of assets and liabilities due to
elimination of intercompany assets and liabilities held by the
consolidated VIE.
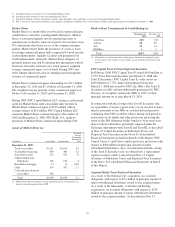
Non-Consolidated VIEs
In millions
Aggregate
Assets
Aggregate
Liabilities
PNC Risk
of Loss
Carrying
Value of
Assets
Carrying
Value of
Liabilities
December 31, 2010
Tax Credit Investments (a) $ 4,086 $ 2,258 $ 782 $ 782(c) $301(d)
Commercial Mortgage-Backed
Securitizations (b) 79,142 79,142 2,068 2,068(e)
Residential Mortgage-Backed
Securitizations (b) 42,986 42,986 2,203 2,199(e) 4 (d)
Collateralized Debt Obligations 18 1 1(c)
Total $126,232 $124,386 $5,054 $5,050 $305
In millions
Aggregate
Assets
Aggregate
Liabilities
PNC Risk
of Loss
December 31, 2009
Market Street $ 3,698 $ 3,718 $6,155(f)
Tax Credit Investments (a) 1,786 1,156 743
Collateralized Debt Obligations 23 2
Total $ 5,507 $ 4,874 $6,900
(a) Amounts reported primarily represent LIHTC investments. Aggregate assets and aggregate liabilities represent estimated balances due to limited availability of financial information
associated with certain acquired partnerships.
(b) Amounts reported reflect involvement with securitization SPEs where PNC transferred to and/or services loans for a SPE and we hold securities issued by that SPE. We also invest in
other mortgage and asset-backed securities issued by third-party VIEs with which we have no continuing involvement. Further information on these securities is included in Note 7
Investment Securities in the Notes to Consolidated Financial Statements in Item 8 of this Report and values disclosed represent our maximum exposure to loss for those securities’
holdings.
44