PNC Bank 2010 Annual Report Download - page 90
Download and view the complete annual report
Please find page 90 of the 2010 PNC Bank annual report below. You can navigate through the pages in the report by either clicking on the pages listed below, or by using the keyword search tool below to find specific information within the annual report.-
 1
1 -
2
-
3
-
4
-
5
-
6
-
7
-
8
-
9
-
10
-
11
-
12
-
13
-
14
-
15
-
16
-
17
-
18
-
19
-
20
-
21
-
22
-
23
-
24
-
25
-
26
-
27
-
28
-
29
-
30
-
31
-
32
-
33
-
34
-
35
-
36
-
37
-
38
-
39
-
40
-
41
-
42
-
43
-
44
-
45
-
46
-
47
-
48
-
49
-
50
-
51
-
52
-
53
-
54
-
55
-
56
-
57
-
58
-
59
-
60
-
61
-
62
-
63
-
64
-
65
-
66
-
67
-
68
-
69
-
70
-
71
-
72
-
73
-
74
-
75
-
76
-
77
-
78
-
79
-
 80
80 -
 81
81 -
 82
82 -
 83
83 -
 84
84 -
 85
85 -
 86
86 -
 87
87 -
 88
88 -
 89
89 -
 90
90 -
 91
91 -
 92
92 -
 93
93 -
 94
94 -
 95
95 -
 96
96 -
 97
97 -
 98
98 -
 99
99 -
 100
100 -
101
-
102
-
103
-
104
-
105
-
106
-
107
-
108
-
109
-
110
-
111
-
112
-
113
-
114
-
115
-
116
-
117
-
118
-
119
-
120
-
121
-
122
-
123
-
124
-
125
-
126
-
127
-
128
-
129
-
130
-
131
-
132
-
133
-
134
-
135
-
136
-
137
-
138
-
139
-
140
-
141
-
142
-
143
-
144
-
145
-
146
-
147
-
148
-
149
-
150
-
151
-
152
-
153
-
154
-
155
-
156
-
157
-
158
-
159
-
160
-
161
-
162
-
163
-
164
-
165
-
166
-
167
-
168
-
169
-
170
-
171
-
172
-
173
-
174
-
175
-
176
-
177
-
178
-
179
-
180
-
181
-
182
-
183
-
184
-
185
-
186
-
187
-
188
-
189
-
190
-
191
-
192
-
193
-
194
-
195
-
196
-
197
-
198
-
199
-
200
-
201
-
202
-
203
-
204
-
205
-
206
-
207
-
208
-
209
-
210
-
211
-
212
-
213
-
214
 |
 |
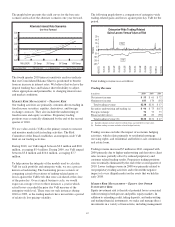
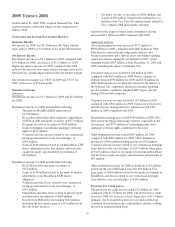
The graph below presents the yield curves for the base rate
scenario and each of the alternate scenarios one year forward.
Alternate Interest Rate Scenarios
One Year Forward
0.0
1.0
2.0
3.0
5.0
4.0
1M LIBOR 2Y Swap 3Y Swap 5Y Swap 10Y Swap
Base Rates PNC Economist Market Forward Two-Ten Slope decrease
The fourth quarter 2010 interest sensitivity analyses indicate
that our Consolidated Balance Sheet is positioned to benefit
from an increase in interest rates. We believe that we have the
deposit funding base and balance sheet flexibility to adjust,
where appropriate and permissible, to changing interest rates
and market conditions.
M
ARKET
R
ISK
M
ANAGEMENT
–T
RADING
R
ISK
Our trading activities are primarily customer-driven trading in
fixed income securities, equities, derivatives, and foreign
exchange contracts. They also include the underwriting of
fixed income and equity securities. Proprietary trading
positions were essentially eliminated by the end of the second
quarter of 2010.
We use value-at-risk (VaR) as the primary means to measure
and monitor market risk in trading activities. The Risk
Committee of the Board establishes an enterprise-wide VaR
limit on our trading activities.
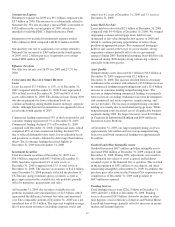
During 2010, our VaR ranged between $2.3 million and $8.8
million, averaging $5.4 million. During 2009, our VaR ranged
between $5.8 million and $10.4 million, averaging $7.7
million.
To help ensure the integrity of the models used to calculate
VaR for each portfolio and enterprise-wide, we use a process
known as backtesting. The backtesting process consists of
comparing actual observations of trading-related gains or
losses against the VaR levels that were calculated at the close
of the prior day. Over a typical business cycle, we would
expect an average of two to three instances a year in which
actual losses exceeded the prior day VaR measure at the
enterprise-wide level. There were no such instances during
2010 or 2009, as the trading markets have moved into a period
of relatively low pricing volatility.
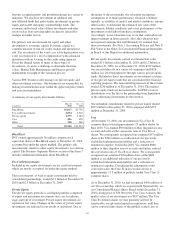
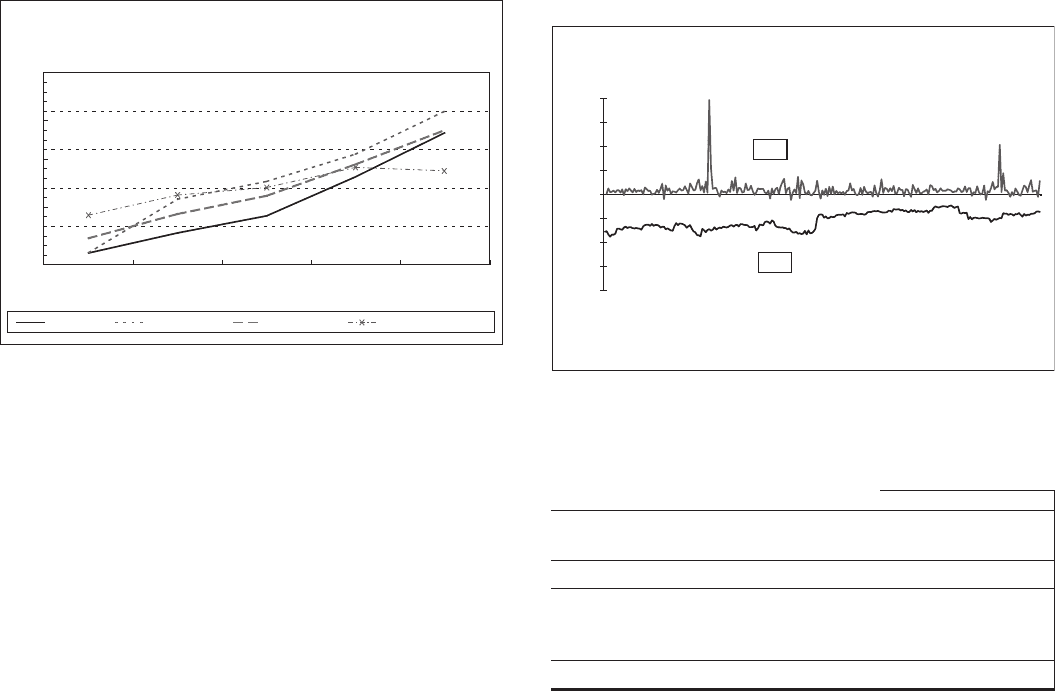
The following graph shows a comparison of enterprise-wide
trading-related gains and losses against prior day VaR for the
period.
Enterprise-Wide Trading-Related
Gains/Losses Versus Value at Risk
(20)
(15)
(10)
(5)
0
5
10
15
20
12/31/09
1/31/10
2/28/10
3/31/10
4/30/10
5/31/10
6/30/10
7/31/10
8/31/10
9/30/10
10/31/10
11/30/10
12/31/10
Millions
VaR
P&L
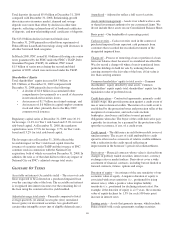
Total trading revenue was as follows:
Trading Revenue
In millions 2010 2009 2008
Net interest income $55 $61 $72
Noninterest income 183 170 (55)
Total trading revenue $238 $231 $ 17
Securities underwriting and trading (a) $94 $ 75 $(17)
Foreign exchange 76 73 73
Financial derivatives 68 83 (39)
Total trading revenue (b) $238 $231 $ 17
(a) Includes changes in fair value for certain loans accounted for at fair value.
(b) Product trading revenue includes related hedged activity.
Trading revenue excludes the impact of economic hedging
activities, which relate primarily to residential mortgage
servicing rights, and residential and held-for-sale commercial
real estate loans.
Trading revenue increased $7 million in 2010 compared with
2009 primarily due to higher underwriting and derivative client
sales revenue, partially offset by reduced proprietary and
customer related trading results. Proprietary trading positions
were essentially eliminated by the end of the second quarter of
2010. Lower trading revenue in 2008 was primarily related to
our proprietary trading activities and reflected the negative
impact of a very illiquid market on the assets that we held in
early 2008.
M
ARKET
R
ISK
M
ANAGEMENT
–E
QUITY
A
ND
O
THER
I
NVESTMENT
R
ISK
Equity investment risk is the risk of potential losses associated
with investing in both private and public equity markets. In
addition to extending credit, taking deposits, and underwriting
and trading financial instruments, we make and manage direct
investments in a variety of transactions, including management
82