PNC Bank 2010 Annual Report Download - page 146
Download and view the complete annual report
Please find page 146 of the 2010 PNC Bank annual report below. You can navigate through the pages in the report by either clicking on the pages listed below, or by using the keyword search tool below to find specific information within the annual report.-
 1
1 -
2
-
3
-
4
-
5
-
6
-
7
-
8
-
9
-
10
-
11
-
12
-
13
-
14
-
15
-
16
-
17
-
18
-
19
-
20
-
21
-
22
-
23
-
24
-
25
-
26
-
27
-
28
-
29
-
30
-
31
-
32
-
33
-
34
-
35
-
36
-
37
-
38
-
39
-
40
-
41
-
42
-
43
-
44
-
45
-
46
-
47
-
48
-
49
-
50
-
51
-
52
-
53
-
54
-
55
-
56
-
57
-
58
-
59
-
60
-
61
-
62
-
63
-
64
-
65
-
66
-
67
-
68
-
69
-
70
-
71
-
72
-
73
-
74
-
75
-
76
-
77
-
78
-
79
-
80
-
81
-
82
-
83
-
84
-
85
-
86
-
87
-
88
-
89
-
90
-
91
-
92
-
93
-
94
-
95
-
96
-
97
-
98
-
99
-
100
-
101
-
102
-
103
-
104
-
105
-
106
-
107
-
108
-
109
-
110
-
111
-
112
-
113
-
114
-
115
-
116
-
117
-
118
-
119
-
120
-
121
-
122
-
123
-
124
-
125
-
126
-
127
-
128
-
129
-
130
-
131
-
132
-
133
-
134
-
135
-
 136
136 -
 137
137 -
 138
138 -
 139
139 -
 140
140 -
 141
141 -
 142
142 -
 143
143 -
 144
144 -
 145
145 -
 146
146 -
 147
147 -
 148
148 -
 149
149 -
 150
150 -
 151
151 -
 152
152 -
 153
153 -
 154
154 -
 155
155 -
 156
156 -
157
-
158
-
159
-
160
-
161
-
162
-
163
-
164
-
165
-
166
-
167
-
168
-
169
-
170
-
171
-
172
-
173
-
174
-
175
-
176
-
177
-
178
-
179
-
180
-
181
-
182
-
183
-
184
-
185
-
186
-
187
-
188
-
189
-
190
-
191
-
192
-
193
-
194
-
195
-
196
-
197
-
198
-
199
-
200
-
201
-
202
-
203
-
204
-
205
-
206
-
207
-
208
-
209
-
210
-
211
-
212
-
213
-
214
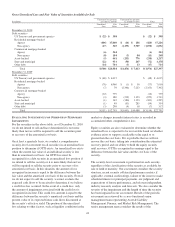
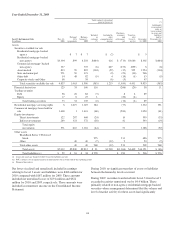
 |
 |

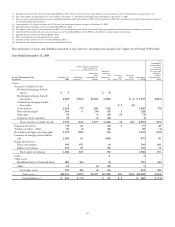
Year Ended December 31, 2009
Level 3 Instruments Only
In millions
Total realized / unrealized
gains or losses (a) (*)
Dec. 31,
2008
National
City
Acquisition
Balance,
January 1,
2009
Included
in
earnings
(*)
Included in
other
comprehensive
income
Purchases,
issuances,
and
settlements,
net
Transfers
into
Level 3,
net (b)
December
31, 2009
Attributable
to unrealized
gains or
losses related
to assets and
liabilities
held at
December 31,
2009
Assets
Securities available for sale
Residential mortgage- backed
agency $ 7 $ 7 $ (2) $ 5
Residential mortgage- backed
non-agency $3,304 899 4,203 $(444) 616 $ (713) $4,640 8,302 $(444)
Commercial mortgage- backed
non-agency 337 337 (6) 627 (253) (699) 6 (6)
Asset-backed 833 59 892 (104) (22) (37) 525 1,254 (104)
State and municipal 271 50 321 (2) (23) (30) 266
Other debt 34 48 82 (9) 4 (19) (5) 53 (9)
Corporate stocks and Other 58 58 (6) (5) 47
Total securities available for sale 4,837 1,063 5,900 (563) 1,215 (1,050) 4,431 9,933 (563)
Financial derivatives 125 35 160 116 (206) (20) 50 11
Trading securities
Debt 56 26 82 (3) 8 2 89
Equity 17 6 23 1 (20) (4)
Total trading securities 73 32 105 (2) (12) (2) 89
Residential mortgage servicing rights 6 1,019 1,025 384 (77) 1,332 351
Commercial mortgage loans held for
sale 1,400 1 1,401 (68) (283) 1,050 (61)
Equity investments
Direct investments 322 287 609 (24) 10 595 (33)
Indirect investments 249 323 572 (20) 41 593 (19)
Total equity
investments 571 610 1,181 (44) 51 1,188 (52)
Other assets
BlackRock Series C Preferred
Stock 275 211 486 275
Other 40 40 (7) (12) 2 23 (7)
Total other assets 40 40 268 (12) 213 509 268
Total assets $7,012 $2,800 $9,812 $ 91 $1,203 $(1,364) $4,409 $14,151 $ (46)
Total liabilities (c) $ 22 $ 16 $ 38 $ 278 $ 190 $ 506 $ 276
(a) Losses for assets are bracketed while losses for liabilities are not.
(b) PNC’s policy is to recognize transfers in and transfers out as of the end of the reporting period.
(c) Financial derivatives.
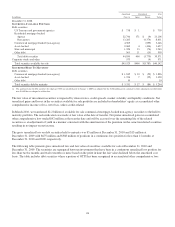
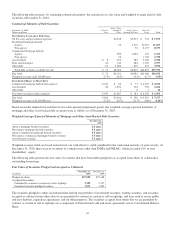
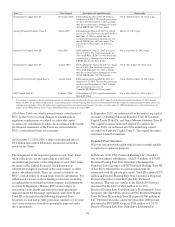
Net losses (realized and unrealized) included in earnings
relating to Level 3 assets and liabilities were $266 million for
2010 compared with $187 million for 2009. These amounts
included net unrealized losses of $291 million and $322
million for 2010 and 2009, respectively. These amounts were
included in noninterest income on the Consolidated Income
Statement.
During 2010, no significant transfers of assets or liabilities
between the hierarchy levels occurred.
During 2009, securities transferred into Level 3 from Level 2
exceeded securities transferred out by $4.4 billion. These
primarily related to non-agency residential mortgage-backed
securities where management determined that the volume and
level of market activity for these assets had significantly
138