PNC Bank 2010 Annual Report Download - page 103
Download and view the complete annual report
Please find page 103 of the 2010 PNC Bank annual report below. You can navigate through the pages in the report by either clicking on the pages listed below, or by using the keyword search tool below to find specific information within the annual report.-
 1
1 -
2
-
3
-
4
-
5
-
6
-
7
-
8
-
9
-
10
-
11
-
12
-
13
-
14
-
15
-
16
-
17
-
18
-
19
-
20
-
21
-
22
-
23
-
24
-
25
-
26
-
27
-
28
-
29
-
30
-
31
-
32
-
33
-
34
-
35
-
36
-
37
-
38
-
39
-
40
-
41
-
42
-
43
-
44
-
45
-
46
-
47
-
48
-
49
-
50
-
51
-
52
-
53
-
54
-
55
-
56
-
57
-
58
-
59
-
60
-
61
-
62
-
63
-
64
-
65
-
66
-
67
-
68
-
69
-
70
-
71
-
72
-
73
-
74
-
75
-
76
-
77
-
78
-
79
-
80
-
81
-
82
-
83
-
84
-
85
-
86
-
87
-
88
-
89
-
90
-
91
-
92
-
 93
93 -
 94
94 -
 95
95 -
 96
96 -
 97
97 -
 98
98 -
 99
99 -
 100
100 -
 101
101 -
 102
102 -
 103
103 -
 104
104 -
 105
105 -
 106
106 -
 107
107 -
 108
108 -
 109
109 -
 110
110 -
 111
111 -
 112
112 -
 113
113 -
114
-
115
-
116
-
117
-
118
-
119
-
120
-
121
-
122
-
123
-
124
-
125
-
126
-
127
-
128
-
129
-
130
-
131
-
132
-
133
-
134
-
135
-
136
-
137
-
138
-
139
-
140
-
141
-
142
-
143
-
144
-
145
-
146
-
147
-
148
-
149
-
150
-
151
-
152
-
153
-
154
-
155
-
156
-
157
-
158
-
159
-
160
-
161
-
162
-
163
-
164
-
165
-
166
-
167
-
168
-
169
-
170
-
171
-
172
-
173
-
174
-
175
-
176
-
177
-
178
-
179
-
180
-
181
-
182
-
183
-
184
-
185
-
186
-
187
-
188
-
189
-
190
-
191
-
192
-
193
-
194
-
195
-
196
-
197
-
198
-
199
-
200
-
201
-
202
-
203
-
204
-
205
-
206
-
207
-
208
-
209
-
210
-
211
-
212
-
213
-
214
 |
 |

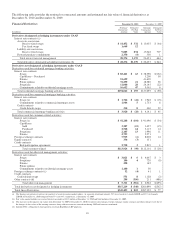
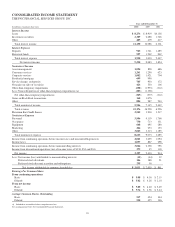
CONSOLIDATED INCOME STATEMENT
THE PNC FINANCIAL SERVICES GROUP, INC.
Year ended December 31
In millions, except per share data 2010 2009 2008
Interest Income
Loans $ 8,276 $ 8,919 $4,138
Investment securities 2,389 2,688 1,746
Other 485 479 417
Total interest income 11,150 12,086 6,301
Interest Expense
Deposits 963 1,741 1,485
Borrowed funds 957 1,262 962
Total interest expense 1,920 3,003 2,447
Net interest income 9,230 9,083 3,854
Noninterest Income
Asset management 1,054 858 686
Consumer services 1,261 1,290 623
Corporate services 1,082 1,021 704
Residential mortgage 699 990
Service charges on deposits 705 950 372
Net gains on sales of securities 426 550 106
Other-than-temporary impairments (608) (1,935) (312)
Less: Noncredit portion of other-than-temporary impairments (a) (283) (1,358)
Net other-than-temporary impairments (325) (577) (312)
Gains on BlackRock transactions 160 1,076
Other 884 987 263
Total noninterest income 5,946 7,145 2,442
Total revenue 15,176 16,228 6,296
Provision For Credit Losses 2,502 3,930 1,517
Noninterest Expense
Personnel 3,906 4,119 1,766
Occupancy 730 713 331
Equipment 668 695 280
Marketing 266 233 123
Other 3,043 3,313 1,185
Total noninterest expense 8,613 9,073 3,685
Income from continuing operations before income taxes and noncontrolling interests 4,061 3,225 1,094
Income taxes 1,037 867 298
Income from continuing operations before noncontrolling interests 3,024 2,358 796
Income from discontinued operations (net of income taxes of $338, $54 and $63) 373 45 118
Net income 3,397 2,403 914
Less: Net income (loss) attributable to noncontrolling interests (15) (44) 32
Preferred stock dividends 146 388 21
Preferred stock discount accretion and redemptions 255 56
Net income attributable to common shareholders $ 3,011 $ 2,003 $ 861
Earnings Per Common Share
From continuing operations
Basic $ 5.08 $ 4.30 $ 2.15
Diluted $ 5.02 $ 4.26 $ 2.10
From net income
Basic $ 5.80 $ 4.40 $ 2.49
Diluted $ 5.74 $ 4.36 $ 2.44
Average Common Shares Outstanding
Basic 517 454 344
Diluted 520 455 346
(a) Included in accumulated other comprehensive loss.
See accompanying Notes To Consolidated Financial Statements.
95