PNC Bank 2010 Annual Report Download - page 39
Download and view the complete annual report
Please find page 39 of the 2010 PNC Bank annual report below. You can navigate through the pages in the report by either clicking on the pages listed below, or by using the keyword search tool below to find specific information within the annual report.-
 1
1 -
2
-
3
-
4
-
5
-
6
-
7
-
8
-
9
-
10
-
11
-
12
-
13
-
14
-
15
-
16
-
17
-
18
-
19
-
20
-
21
-
22
-
23
-
24
-
25
-
26
-
27
-
28
-
 29
29 -
 30
30 -
 31
31 -
 32
32 -
 33
33 -
 34
34 -
 35
35 -
 36
36 -
 37
37 -
 38
38 -
 39
39 -
 40
40 -
 41
41 -
 42
42 -
 43
43 -
 44
44 -
 45
45 -
 46
46 -
 47
47 -
 48
48 -
 49
49 -
50
-
51
-
52
-
53
-
54
-
55
-
56
-
57
-
58
-
59
-
60
-
61
-
62
-
63
-
64
-
65
-
66
-
67
-
68
-
69
-
70
-
71
-
72
-
73
-
74
-
75
-
76
-
77
-
78
-
79
-
80
-
81
-
82
-
83
-
84
-
85
-
86
-
87
-
88
-
89
-
90
-
91
-
92
-
93
-
94
-
95
-
96
-
97
-
98
-
99
-
100
-
101
-
102
-
103
-
104
-
105
-
106
-
107
-
108
-
109
-
110
-
111
-
112
-
113
-
114
-
115
-
116
-
117
-
118
-
119
-
120
-
121
-
122
-
123
-
124
-
125
-
126
-
127
-
128
-
129
-
130
-
131
-
132
-
133
-
134
-
135
-
136
-
137
-
138
-
139
-
140
-
141
-
142
-
143
-
144
-
145
-
146
-
147
-
148
-
149
-
150
-
151
-
152
-
153
-
154
-
155
-
156
-
157
-
158
-
159
-
160
-
161
-
162
-
163
-
164
-
165
-
166
-
167
-
168
-
169
-
170
-
171
-
172
-
173
-
174
-
175
-
176
-
177
-
178
-
179
-
180
-
181
-
182
-
183
-
184
-
185
-
186
-
187
-
188
-
189
-
190
-
191
-
192
-
193
-
194
-
195
-
196
-
197
-
198
-
199
-
200
-
201
-
202
-
203
-
204
-
205
-
206
-
207
-
208
-
209
-
210
-
211
-
212
-
213
-
214
 |
 |

C
ONSOLIDATED
I
NCOME
S
TATEMENT
R
EVIEW
Net income for 2010 was $3.4 billion compared with
$2.4 billion for 2009. Results for 2010 include the impact of a
$328 million after-tax gain related to our sale of GIS. Results
for 2009 include the impact of a $687 million after-tax gain
resulting from BlackRock’s acquisition of BGI. Our
Consolidated Income Statement is presented in Item 8 of this
Report.
N
ET
I
NTEREST
I
NCOME AND
N
ET
I
NTEREST
M
ARGIN
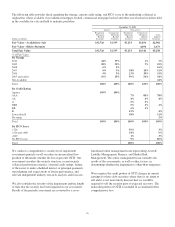
Year ended December 31
Dollars in millions 2010 2009
Net interest income $9,230 $9,083
Net interest margin 4.14% 3.82%
Changes in net interest income and margin result from the
interaction of the volume and composition of interest-earning
assets and related yields, interest-bearing liabilities and related
rates paid, and noninterest-bearing sources of funding. See the
Statistical Information (Unaudited) – Analysis Of
Year-To-Year Changes In Net Interest Income and Average
Consolidated Balance Sheet And Net Interest Analysis in
Item 8 of this Report for additional information.
The increase in net interest income for 2010 compared with
2009 resulted primarily from the impact of lower deposit and
borrowing costs somewhat offset by lower purchase
accounting accretion, lower loan volume and lower revenue
from our investment securities portfolio. Our deposit strategy
included the retention and repricing at lower rates of
relationship-based certificates of deposit and the planned run
off of maturing non-relationship certificates of deposit and
brokered deposits.
As further discussed in the Retail Banking section of the
Business Segments Review portion of this Item 7, the Credit
CARD Act of 2009 negatively impacted 2010 revenues by
approximately $75 million, largely in net interest income.
The net interest margin was 4.14% for 2010 and 3.82% for
2009. The following factors impacted the comparison:
• A decrease in the rate accrued on interest-bearing
liabilities of 49 basis points. The rate accrued on
interest-bearing deposits, the largest component,
decreased 47 basis points.
• A decrease in the yield on interest-earning assets of
10 basis points. The yield on loans, the largest
portion of our interest-earning assets, increased only
1 basis point and was more than offset by the 102
basis point decline in yield on investment securities.
• The benefit of noninterest-bearing sources of funding
decreased 7 basis points primarily due to the decline
in interest rates.
We expect that our purchase accounting accretion will
decrease by as much as $700 million in 2011. Excluding the
impact of this factor, we expect our net interest income to
increase in 2011. Overall, we also expect that our net interest
margin will decline in 2011.
N
ONINTEREST
I
NCOME
Summary
Noninterest income was $5.9 billion in 2010, a decline of
$1.2 billion from $7.1 billion in 2009. Noninterest income for
2009 included the $1.1 billion pretax gain recognized on our
portion of the increase in BlackRock’s equity resulting from
the value of BlackRock shares issued in connection with
BlackRock’s acquisition of BGI.
Aside from the impact of the 2009 BlackRock/BGI gain,
lower noninterest income in 2010 reflected the impact of
decreases in the following: residential mortgage loan sales
revenue, the value of commercial mortgage servicing rights,
net hedging gains on residential mortgage servicing rights,
service charges on deposits including the negative impact of
the new Regulation E rules, and net gains on sales of
securities. Partially offsetting these items were lower OTTI
charges, higher asset management revenue, a fourth quarter
2010 gain on 7.5 million BlackRock common shares sold by
PNC as part of a BlackRock secondary common stock
offering and higher revenue from capital markets-related
products and services including merger and acquisition
advisory fees.
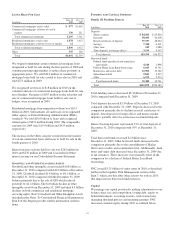
Additional Analysis
Asset management revenue was $1.1 billion in 2010 compared
with $858 million in 2009. This increase reflected higher
equity earnings from our BlackRock investment, improved
equity markets and client growth. Discretionary assets under
management at December 31, 2010 totaled $108 billion
compared with $103 billion at December 31, 2009.
Consumer services fees totaled $1.3 billion in both 2010 and
2009. Consumer service fees for 2010 reflected higher
volume-related transaction fees offset by lower brokerage fees
and the impact of the consolidation of the securitized credit
card portfolio.
Corporate services revenue totaled $1.1 billion in 2010 and
$1.0 billion in 2009. The increase was largely the result of
higher merger and acquisition advisory and ancillary
commercial mortgage servicing fees partially offset by a
reduction in the value of commercial mortgage servicing
rights largely driven by lower interest rates. Corporate
services fees include the noninterest component of treasury
management fees, which continued to be a strong contributor
to revenue.
Residential mortgage revenue totaled $699 million in 2010
compared with $990 million in 2009. The decline in 2010
reflected reduced loan sales revenue following the strong loan
origination refinance volume in 2009 and lower net hedging
gains on mortgage servicing rights.
31