PNC Bank 2010 Annual Report Download - page 43
Download and view the complete annual report
Please find page 43 of the 2010 PNC Bank annual report below. You can navigate through the pages in the report by either clicking on the pages listed below, or by using the keyword search tool below to find specific information within the annual report.-
 1
1 -
2
-
3
-
4
-
5
-
6
-
7
-
8
-
9
-
10
-
11
-
12
-
13
-
14
-
15
-
16
-
17
-
18
-
19
-
20
-
21
-
22
-
23
-
24
-
25
-
26
-
27
-
28
-
29
-
30
-
31
-
32
-
 33
33 -
 34
34 -
 35
35 -
 36
36 -
 37
37 -
 38
38 -
 39
39 -
 40
40 -
 41
41 -
 42
42 -
 43
43 -
 44
44 -
 45
45 -
 46
46 -
 47
47 -
 48
48 -
 49
49 -
 50
50 -
 51
51 -
 52
52 -
 53
53 -
54
-
55
-
56
-
57
-
58
-
59
-
60
-
61
-
62
-
63
-
64
-
65
-
66
-
67
-
68
-
69
-
70
-
71
-
72
-
73
-
74
-
75
-
76
-
77
-
78
-
79
-
80
-
81
-
82
-
83
-
84
-
85
-
86
-
87
-
88
-
89
-
90
-
91
-
92
-
93
-
94
-
95
-
96
-
97
-
98
-
99
-
100
-
101
-
102
-
103
-
104
-
105
-
106
-
107
-
108
-
109
-
110
-
111
-
112
-
113
-
114
-
115
-
116
-
117
-
118
-
119
-
120
-
121
-
122
-
123
-
124
-
125
-
126
-
127
-
128
-
129
-
130
-
131
-
132
-
133
-
134
-
135
-
136
-
137
-
138
-
139
-
140
-
141
-
142
-
143
-
144
-
145
-
146
-
147
-
148
-
149
-
150
-
151
-
152
-
153
-
154
-
155
-
156
-
157
-
158
-
159
-
160
-
161
-
162
-
163
-
164
-
165
-
166
-
167
-
168
-
169
-
170
-
171
-
172
-
173
-
174
-
175
-
176
-
177
-
178
-
179
-
180
-
181
-
182
-
183
-
184
-
185
-
186
-
187
-
188
-
189
-
190
-
191
-
192
-
193
-
194
-
195
-
196
-
197
-
198
-
199
-
200
-
201
-
202
-
203
-
204
-
205
-
206
-
207
-
208
-
209
-
210
-
211
-
212
-
213
-
214
 |
 |

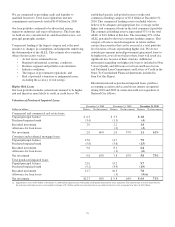
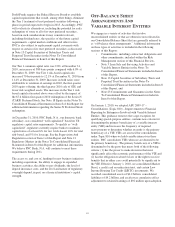
We are committed to providing credit and liquidity to
qualified borrowers. Total loan originations and new
commitments and renewals totaled $149 billion for 2010.
Our loan portfolio continued to be diversified among
numerous industries and types of businesses. The loans that
we hold are also concentrated in, and diversified across, our
principal geographic markets.
Commercial lending is the largest category and is the most
sensitive to changes in assumptions and judgments underlying
the determination of the ALLL. This estimate also considers
other relevant factors such as:
• Actual versus estimated losses,
• Regional and national economic conditions,
• Business segment and portfolio concentrations,
• Industry conditions,
• The impact of government regulations, and
• Risk of potential estimation or judgmental errors,
including the accuracy of risk ratings.
Higher Risk Loans
Our loan portfolio includes certain loans deemed to be higher
risk and therefore more likely to result in credit losses. We
established specific and pooled reserves on the total
commercial lending category of $2.6 billion at December 31,
2010. This commercial lending reserve included what we
believe to be adequate and appropriate loss coverage on the
higher risk commercial loans in the total commercial portfolio.
The commercial lending reserve represented 53% of the total
ALLL of $4.9 billion at that date. The remaining 47% of the
ALLL pertained to the total consumer lending category. This
category of loans is more homogenous in nature and has
certain characteristics that can be assessed at a total portfolio
level in terms of loans representing higher risk. We do not
consider government insured/government guaranteed loans to
be higher risk as we do not believe these loans will result in a
significant loss because of their structure. Additional
information regarding our higher risk loans is included in Note
5 Asset Quality and Allowances for Loan and Lease Losses
and Unfunded Loan Commitments and Letters of Credit in the
Notes To Consolidated Financial Statements included in
Item 8 of this Report.
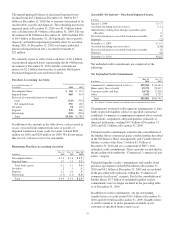
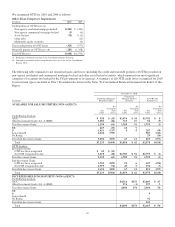
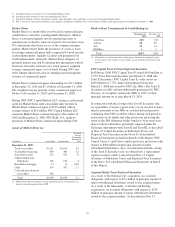
Information related to purchased impaired loans, purchase
accounting accretion and accretable net interest recognized
during 2010 and 2009 in connection with our acquisition of
National City follows.
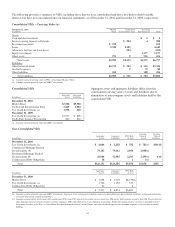
Valuation of Purchased Impaired Loans
December 31, 2008 December 31, 2009 December 31, 2010
Dollars in billions Balance Net Investment Balance Net Investment Balance Net Investment
Commercial and commercial real estate loans:
Unpaid principal balance $ 6.3 $ 3.5 $ 1.8
Purchased impaired mark (3.4) (1.3) (.4)
Recorded investment 2.9 2.2 1.4
Allowance for loan losses (.2) (.3)
Net investment 2.9 46% 2.0 57% 1.1 61%
Consumer and residential mortgage loans:
Unpaid principal balance 15.6 11.7 7.9
Purchased impaired mark (5.8) (3.6) (1.5)
Recorded investment 9.8 8.1 6.4
Allowance for loan losses (.3) (.6)
Net investment 9.8 63% 7.8 67% 5.8 73%
Total purchased impaired loans:
Unpaid principal balance 21.9 15.2 9.7
Purchased impaired mark (9.2) (4.9) (1.9)
Recorded investment 12.7 10.3 7.8
Allowance for loan losses (.5) (.9)(a)
Net investment $12.7 58% $ 9.8 64% $ 6.9 71%
(a) Impairment reserves of $.9 billion at December 31, 2010 reflect impaired loans with further credit quality deterioration since acquisition. This deterioration was more than offset by
the cash received to date in excess of recorded investment of $.7 billion and the net reclassification to accretable net interest, to be recognized over time, of $1.1 billion.
35