PNC Bank 2010 Annual Report Download - page 89
Download and view the complete annual report
Please find page 89 of the 2010 PNC Bank annual report below. You can navigate through the pages in the report by either clicking on the pages listed below, or by using the keyword search tool below to find specific information within the annual report.-
 1
1 -
2
-
3
-
4
-
5
-
6
-
7
-
8
-
9
-
10
-
11
-
12
-
13
-
14
-
15
-
16
-
17
-
18
-
19
-
20
-
21
-
22
-
23
-
24
-
25
-
26
-
27
-
28
-
29
-
30
-
31
-
32
-
33
-
34
-
35
-
36
-
37
-
38
-
39
-
40
-
41
-
42
-
43
-
44
-
45
-
46
-
47
-
48
-
49
-
50
-
51
-
52
-
53
-
54
-
55
-
56
-
57
-
58
-
59
-
60
-
61
-
62
-
63
-
64
-
65
-
66
-
67
-
68
-
69
-
70
-
71
-
72
-
73
-
74
-
75
-
76
-
77
-
78
-
 79
79 -
 80
80 -
 81
81 -
 82
82 -
 83
83 -
 84
84 -
 85
85 -
 86
86 -
 87
87 -
 88
88 -
 89
89 -
 90
90 -
 91
91 -
 92
92 -
 93
93 -
 94
94 -
 95
95 -
 96
96 -
 97
97 -
 98
98 -
 99
99 -
100
-
101
-
102
-
103
-
104
-
105
-
106
-
107
-
108
-
109
-
110
-
111
-
112
-
113
-
114
-
115
-
116
-
117
-
118
-
119
-
120
-
121
-
122
-
123
-
124
-
125
-
126
-
127
-
128
-
129
-
130
-
131
-
132
-
133
-
134
-
135
-
136
-
137
-
138
-
139
-
140
-
141
-
142
-
143
-
144
-
145
-
146
-
147
-
148
-
149
-
150
-
151
-
152
-
153
-
154
-
155
-
156
-
157
-
158
-
159
-
160
-
161
-
162
-
163
-
164
-
165
-
166
-
167
-
168
-
169
-
170
-
171
-
172
-
173
-
174
-
175
-
176
-
177
-
178
-
179
-
180
-
181
-
182
-
183
-
184
-
185
-
186
-
187
-
188
-
189
-
190
-
191
-
192
-
193
-
194
-
195
-
196
-
197
-
198
-
199
-
200
-
201
-
202
-
203
-
204
-
205
-
206
-
207
-
208
-
209
-
210
-
211
-
212
-
213
-
214
 |
 |

M
ARKET
R
ISK
M
ANAGEMENT
O
VERVIEW
Market risk is the risk of a loss in earnings or economic value
due to adverse movements in market factors such as interest
rates, credit spreads, foreign exchange rates, and equity prices.
We are exposed to market risk primarily by our involvement
in the following activities, among others:
• Traditional banking activities of taking deposits and
extending loans,
• Private equity and other investments and activities
whose economic values are directly impacted by
market factors, and
• Trading in fixed income products, equities,
derivatives, and foreign exchange, as a result of
customer activities, underwriting, and proprietary
trading.
We have established enterprise-wide policies and
methodologies to identify, measure, monitor, and report
market risk. Market Risk Management provides independent
oversight by monitoring compliance with these limits and
guidelines, and reporting significant risks in the business to
the Risk Committee of the Board.
M
ARKET
R
ISK
M
ANAGEMENT
–I
NTEREST
R
ATE
R
ISK
Interest rate risk results primarily from our traditional banking
activities of gathering deposits and extending loans. Many
factors, including economic and financial conditions,
movements in interest rates, and consumer preferences, affect
the difference between the interest that we earn on assets and
the interest that we pay on liabilities and the level of our
noninterest-bearing funding sources. Due to the repricing term
mismatches and embedded options inherent in certain of these
products, changes in market interest rates not only affect
expected near-term earnings, but also the economic values of
these assets and liabilities.
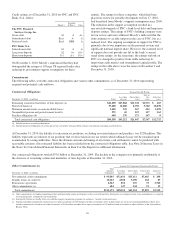
Asset and Liability Management centrally manages interest
rate risk within limits and guidelines set forth in our risk
management policies approved by management’s Asset and
Liability Committee and the Risk Committee of the Board.
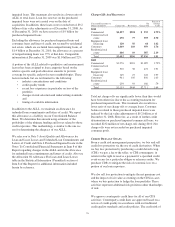
Sensitivity results and market interest rate benchmarks for the
fourth quarters of 2010 and 2009 follow:
Interest Sensitivity Analysis
Fourth
Quarter
2010
Fourth
Quarter
2009
Net Interest Income Sensitivity Simulation
Effect on net interest income in first year
from gradual interest rate change over
following 12 months of:
100 basis point increase 1.4% 1.1%
100 basis point decrease (a) (1.4)% (2.0)%
Effect on net interest income in second year
from gradual interest rate change over the
preceding 12 months of:
100 basis point increase 4.1% 1.4%
100 basis point decrease (a) (4.8)% (6.0)%
Duration of Equity Model (a)
Base case duration of equity (in years): (.5) (1.2)
Key Period-End Interest Rates
One-month LIBOR .26% .23%
Three-year swap 1.28% 2.06%
(a) Given the inherent limitations in certain of these measurement tools and techniques,
results become less meaningful as interest rates approach zero.
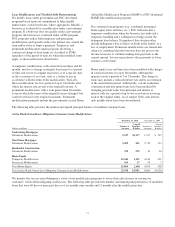
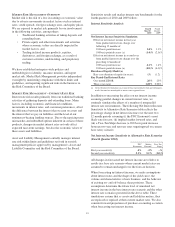
In addition to measuring the effect on net interest income
assuming parallel changes in current interest rates, we
routinely simulate the effects of a number of nonparallel
interest rate environments. The following Net Interest Income
Sensitivity to Alternative Rate Scenarios table reflects the
percentage change in net interest income over the next two
12-month periods assuming (i) the PNC Economist’s most
likely rate forecast, (ii) implied market forward rates, and
(iii) a Two-Ten Slope decrease (a 200 basis point decrease
between two-year and ten-year rates superimposed on current
base rates) scenario.
Net Interest Income Sensitivity to Alternative Rate Scenarios
(Fourth Quarter 2010)
PNC
Economist
Market
Forward
Two-Ten
Slope
First year sensitivity .4% .4% –%
Second year sensitivity 3.1% 3.1% (1.0)%
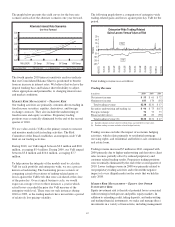
All changes in forecasted net interest income are relative to
results in a base rate scenario where current market rates are
assumed to remain unchanged over the forecast horizon.
When forecasting net interest income, we make assumptions
about interest rates and the shape of the yield curve, the
volume and characteristics of new business, and the behavior
of existing on- and off-balance sheet positions. These
assumptions determine the future level of simulated net
interest income in the base interest rate scenario and the other
interest rate scenarios presented in the above table. These
simulations assume that as assets and liabilities mature, they
are replaced or repriced at then current market rates. We also
consider forward projections of purchase accounting accretion
when forecasting net interest income.
81