PNC Bank 2010 Annual Report Download - page 77
Download and view the complete annual report
Please find page 77 of the 2010 PNC Bank annual report below. You can navigate through the pages in the report by either clicking on the pages listed below, or by using the keyword search tool below to find specific information within the annual report.-
 1
1 -
2
-
3
-
4
-
5
-
6
-
7
-
8
-
9
-
10
-
11
-
12
-
13
-
14
-
15
-
16
-
17
-
18
-
19
-
20
-
21
-
22
-
23
-
24
-
25
-
26
-
27
-
28
-
29
-
30
-
31
-
32
-
33
-
34
-
35
-
36
-
37
-
38
-
39
-
40
-
41
-
42
-
43
-
44
-
45
-
46
-
47
-
48
-
49
-
50
-
51
-
52
-
53
-
54
-
55
-
56
-
57
-
58
-
59
-
60
-
61
-
62
-
63
-
64
-
65
-
66
-
 67
67 -
 68
68 -
 69
69 -
 70
70 -
 71
71 -
 72
72 -
 73
73 -
 74
74 -
 75
75 -
 76
76 -
 77
77 -
 78
78 -
 79
79 -
 80
80 -
 81
81 -
 82
82 -
 83
83 -
 84
84 -
 85
85 -
 86
86 -
 87
87 -
88
-
89
-
90
-
91
-
92
-
93
-
94
-
95
-
96
-
97
-
98
-
99
-
100
-
101
-
102
-
103
-
104
-
105
-
106
-
107
-
108
-
109
-
110
-
111
-
112
-
113
-
114
-
115
-
116
-
117
-
118
-
119
-
120
-
121
-
122
-
123
-
124
-
125
-
126
-
127
-
128
-
129
-
130
-
131
-
132
-
133
-
134
-
135
-
136
-
137
-
138
-
139
-
140
-
141
-
142
-
143
-
144
-
145
-
146
-
147
-
148
-
149
-
150
-
151
-
152
-
153
-
154
-
155
-
156
-
157
-
158
-
159
-
160
-
161
-
162
-
163
-
164
-
165
-
166
-
167
-
168
-
169
-
170
-
171
-
172
-
173
-
174
-
175
-
176
-
177
-
178
-
179
-
180
-
181
-
182
-
183
-
184
-
185
-
186
-
187
-
188
-
189
-
190
-
191
-
192
-
193
-
194
-
195
-
196
-
197
-
198
-
199
-
200
-
201
-
202
-
203
-
204
-
205
-
206
-
207
-
208
-
209
-
210
-
211
-
212
-
213
-
214
 |
 |
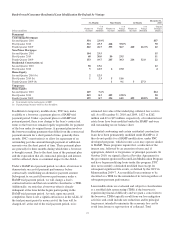
risks at pool and exposure levels while we estimate the
remaining risk types at an institution or business segment
level. We routinely compare the output of our economic
capital model with industry benchmarks.
Risk Control Strategies
Risk management is not about eliminating risks, but about
identifying and accepting risks and then working to effectively
manage them so as to optimize shareholder value.
We centrally manage policy development and exception
approval and oversight through corporate-level risk
management. Some of these policies express our risk appetite
through limits to the acceptable level of risk. We are in excess
of certain limits and are progressively managing to bring our
risks within policy. We are also reviewing and revising certain
policies to better reflect our larger and more complex
organization. Corporate risk management is authorized to take
action to either prevent or mitigate unapproved exceptions to
policies and is responsible for monitoring compliance with
risk management policies. The Corporate Audit function
performs an independent assessment of the internal control
environment. Corporate Audit plays a critical role in risk
management, testing the operation of the internal control
system and reporting findings to management and to the Audit
Committee of the Board.
Risk Monitoring
Corporate Risk Management reports on a regular basis to our
Board regarding the enterprise risk profile of the Corporation.
These reports aggregate and present the level of risk by type
of risk and communicate significant risk issues, including
performance relative to risk tolerance limits. Both the Board
and the EC provide guidance on actions to address key risk
issues as identified in these reports.
C
REDIT
R
ISK
M
ANAGEMENT
Credit risk represents the possibility that a customer,
counterparty or issuer may not perform in accordance with
contractual terms. Credit risk is inherent in the financial
services business and results from extending credit to
customers, purchasing securities, and entering into financial
derivative transactions and certain guarantee contracts. Credit
risk is one of our most significant risks.
Approved risk tolerances, in addition to credit policies and
procedures, set portfolio objectives for the level of credit risk.
We have established guidelines for problem loans, acceptable
levels of total borrower exposure, and other credit measures.
We seek to achieve our credit portfolio objectives by
maintaining a customer base that is diverse in borrower
exposure and industry types. We use loan sales and
syndications and the purchase of credit derivatives to reduce
risk concentrations. Corporate Credit personnel also
participate in loan underwriting and approval processes to
help ensure that newly approved loans meet policy and
portfolio objectives.
The credit granting businesses maintain direct responsibility
for monitoring credit risk within PNC. The Corporate Credit
Policy area provides independent oversight to the
measurement, monitoring and reporting of our credit risk and
reports to the Chief Risk Officer. Corporate Audit also
provides an independent assessment of the effectiveness of the
credit risk management process. We also manage credit risk in
accordance with regulatory guidance.
N
ONPERFORMING
A
SSETS
,T
ROUBLED
D
EBT
R
ESTRUCTURINGS
A
ND
L
OAN
D
ELINQUENCIES
Credit quality showed signs of improvement during 2010 and
delinquency measures improved compared with prior periods.
During 2010, we continued to see an improvement in credit
migration for performing loans and a reduction in overall
credit exposure.
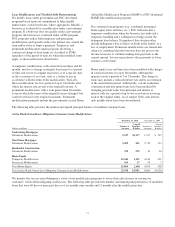
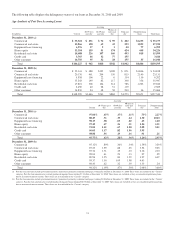
Nonperforming assets decreased $1.0 billion to $5.3 billion at
December 31, 2010 compared with $6.3 billion at
December 31, 2009. Nonperforming loans decreased
$1.2 billion to $4.5 billion since December 31, 2009 while
foreclosed and other assets increased $190 million to
$835 million. The decrease in nonperforming loans was
primarily due to improvements in our commercial lending and
residential real estate portfolios, partially offset by increases
in our consumer home equity portfolio. These consumer home
equity nonperforming loan increases were largely due to
increases in troubled debt restructurings (TDRs), as discussed
in more detail below. Our foreclosed and other assets levels
remained elevated as additions exceeded the ongoing high
level of asset sales and other reductions. As of year-end,
approximately 58% of our foreclosed and other assets are
composed of single family residential properties.
Nonperforming assets fell to 3.50% of total loans and
foreclosed and other assets at December 31, 2010 compared
with 3.99% at December 31, 2009. Loans held for sale are
excluded from nonperforming loans.
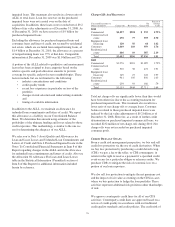
Nonperforming assets at December 31, 2010 declined in the
Corporate & Institutional Banking, Asset Management Group,
Residential Mortgage Banking, and Distressed Assets
Portfolio business segments compared with the balances at
December 31, 2009 and increased 18% in the Retail Banking
business segment. Increases in Retail Banking nonperforming
assets largely reflect the addition of consumer TDRs.
At December 31, 2010, our largest nonperforming asset was
$35 million in the Accommodation and Food Services
Industry and our average nonperforming loan associated with
commercial lending was approximately $1 million.
Purchased impaired loans are excluded from nonperforming
loans. These loans are considered performing, even if
contractually past due (or if we do not expect to receive
payment in full based on the original contractual terms), as we
are currently accreting interest income over the expected life
of the loans. The accretable yield represents the excess of the
69