PNC Bank 2010 Annual Report Download - page 88
Download and view the complete annual report
Please find page 88 of the 2010 PNC Bank annual report below. You can navigate through the pages in the report by either clicking on the pages listed below, or by using the keyword search tool below to find specific information within the annual report.-
 1
1 -
2
-
3
-
4
-
5
-
6
-
7
-
8
-
9
-
10
-
11
-
12
-
13
-
14
-
15
-
16
-
17
-
18
-
19
-
20
-
21
-
22
-
23
-
24
-
25
-
26
-
27
-
28
-
29
-
30
-
31
-
32
-
33
-
34
-
35
-
36
-
37
-
38
-
39
-
40
-
41
-
42
-
43
-
44
-
45
-
46
-
47
-
48
-
49
-
50
-
51
-
52
-
53
-
54
-
55
-
56
-
57
-
58
-
59
-
60
-
61
-
62
-
63
-
64
-
65
-
66
-
67
-
68
-
69
-
70
-
71
-
72
-
73
-
74
-
75
-
76
-
77
-
 78
78 -
 79
79 -
 80
80 -
 81
81 -
 82
82 -
 83
83 -
 84
84 -
 85
85 -
 86
86 -
 87
87 -
 88
88 -
 89
89 -
 90
90 -
 91
91 -
 92
92 -
 93
93 -
 94
94 -
 95
95 -
 96
96 -
 97
97 -
 98
98 -
99
-
100
-
101
-
102
-
103
-
104
-
105
-
106
-
107
-
108
-
109
-
110
-
111
-
112
-
113
-
114
-
115
-
116
-
117
-
118
-
119
-
120
-
121
-
122
-
123
-
124
-
125
-
126
-
127
-
128
-
129
-
130
-
131
-
132
-
133
-
134
-
135
-
136
-
137
-
138
-
139
-
140
-
141
-
142
-
143
-
144
-
145
-
146
-
147
-
148
-
149
-
150
-
151
-
152
-
153
-
154
-
155
-
156
-
157
-
158
-
159
-
160
-
161
-
162
-
163
-
164
-
165
-
166
-
167
-
168
-
169
-
170
-
171
-
172
-
173
-
174
-
175
-
176
-
177
-
178
-
179
-
180
-
181
-
182
-
183
-
184
-
185
-
186
-
187
-
188
-
189
-
190
-
191
-
192
-
193
-
194
-
195
-
196
-
197
-
198
-
199
-
200
-
201
-
202
-
203
-
204
-
205
-
206
-
207
-
208
-
209
-
210
-
211
-
212
-
213
-
214
 |
 |

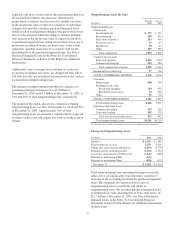
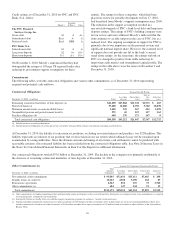
Credit ratings as of December 31, 2010 for PNC and PNC
Bank, N.A. follow:
Moody’s
Standard
& Poor’s Fitch
The PNC Financial
Services Group, Inc.
Senior debt A3 A A+
Subordinated debt Baa1 A- A
Preferred stock Baa3 BBB A
PNC Bank, N.A.
Subordinated debt A3 A A
Long-term deposits A2 A+ AA-
Short-term deposits P-1 A-1 F1+
On November 1, 2010, Moody’s announced that they had
downgraded the ratings of 10 large US regional banks after
reducing its government support assumptions for these
entities. The ratings for these companies, which had been
placed on review for possible downgrade on July 27, 2010,
had benefitted from Moody’s support assumptions since 2009.
The reduction in the support assumption resulted in a
one-notch downgrade of PNC’s bank-level debt and long-term
deposits ratings. The ratings of PNC’s holding company were
not on review and were affirmed. Moody’s indicated that the
firm continues to ascribe support in the case of PNC, but at a
reduced level. The ongoing assumption of support for PNC is
primarily due to our importance in the payment system and
significant national deposit share. However, the assumed level
of support does not provide any lift to the bank’s current
stand-alone ratings. At the same time, the ratings outlook on
PNC was changed to positive from stable reflecting its
improving credit metrics and strengthened capital profile. The
ratings in the table above were the same on November 1 and
December 31, 2010.
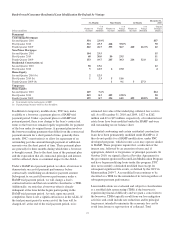
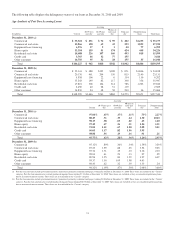
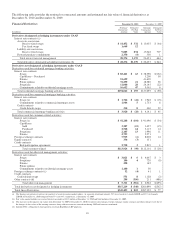
Commitments
The following tables set forth contractual obligations and various other commitments as of December 31, 2010 representing
required and potential cash outflows.
Contractual Obligations Payment Due By Period
December 31, 2010 - in millions Total
Less than
one year
One to three
years
Four to
five
years
After five
years
Remaining contractual maturities of time deposits (a) $41,400 $27,868 $11,334 $1,533 $ 665
Borrowed funds (a) 39,488 14,680 8,750 5,360 10,698
Minimum annual rentals on noncancellable leases 2,400 325 567 410 1,098
Nonqualified pension and postretirement benefits 572 69 123 117 263
Purchase obligations (b) 698 270 273 147 8
Total contractual cash obligations $84,558 $43,212 $21,047 $7,567 $12,732
(a) Includes purchase accounting adjustments.
(b) Includes purchased obligations for goods and services covered by noncancellable contracts and contracts including cancellation fees.
At December 31, 2010, the liability for uncertain tax positions, excluding associated interest and penalties, was $238 million. This
liability represents an estimate of tax positions that we have taken in our tax returns which ultimately may not be sustained upon
examination by taxing authorities. Since the ultimate amount and timing of any future cash settlements cannot be predicted with
reasonable certainty, this estimated liability has been excluded from the contractual obligations table. See Note 20 Income Taxes in
the Notes To Consolidated Financial Statements in Item 8 of this Report for additional information.
Our contractual obligations totaled $97.6 billion at December 31, 2009. The decline in the comparison is primarily attributable to
the decrease of remaining contractual maturities of time deposits at December 31, 2010.
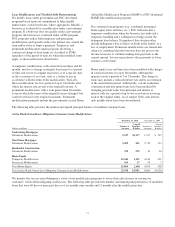
Other Commitments (a) Amount Of Commitment Expiration By Period
December 31, 2010 - in millions
Total
Amounts
Committed
Less than
one year
One to three
years
Four to five
years
After five
years
Net unfunded credit commitments $ 95,805 $52,431 $35,611 $7,465 $ 298
Standby letters of credit (b) 10,143 4,500 5,290 264 89
Reinsurance agreements 4,543 832 119 72 3,520
Other commitments (c) 684 347 234 91 12
Total commitments $111,175 $58,110 $41,254 $7,892 $3,919
(a) Other commitments are funding commitments that could potentially require performance in the event of demands by third parties or contingent events. Loan commitments are reported
net of participations, assignments and syndications.
(b) Includes $6.8 billion of standby letters of credit that support remarketing programs for customers’ variable rate demand notes.
(c) Includes unfunded commitments related to private equity investments of $319 million and other investments of $11 million which are not on our Consolidated Balance Sheet. Also
includes commitments related to tax credit investments of $316 million and other direct equity investments of $38 million which are included in other liabilities on the Consolidated
Balance Sheet.
80