PNC Bank 2010 Annual Report Download - page 191
Download and view the complete annual report
Please find page 191 of the 2010 PNC Bank annual report below. You can navigate through the pages in the report by either clicking on the pages listed below, or by using the keyword search tool below to find specific information within the annual report.-
 1
1 -
2
-
3
-
4
-
5
-
6
-
7
-
8
-
9
-
10
-
11
-
12
-
13
-
14
-
15
-
16
-
17
-
18
-
19
-
20
-
21
-
22
-
23
-
24
-
25
-
26
-
27
-
28
-
29
-
30
-
31
-
32
-
33
-
34
-
35
-
36
-
37
-
38
-
39
-
40
-
41
-
42
-
43
-
44
-
45
-
46
-
47
-
48
-
49
-
50
-
51
-
52
-
53
-
54
-
55
-
56
-
57
-
58
-
59
-
60
-
61
-
62
-
63
-
64
-
65
-
66
-
67
-
68
-
69
-
70
-
71
-
72
-
73
-
74
-
75
-
76
-
77
-
78
-
79
-
80
-
81
-
82
-
83
-
84
-
85
-
86
-
87
-
88
-
89
-
90
-
91
-
92
-
93
-
94
-
95
-
96
-
97
-
98
-
99
-
100
-
101
-
102
-
103
-
104
-
105
-
106
-
107
-
108
-
109
-
110
-
111
-
112
-
113
-
114
-
115
-
116
-
117
-
118
-
119
-
120
-
121
-
122
-
123
-
124
-
125
-
126
-
127
-
128
-
129
-
130
-
131
-
132
-
133
-
134
-
135
-
136
-
137
-
138
-
139
-
140
-
141
-
142
-
143
-
144
-
145
-
146
-
147
-
148
-
149
-
150
-
151
-
152
-
153
-
154
-
155
-
156
-
157
-
158
-
159
-
160
-
161
-
162
-
163
-
164
-
165
-
166
-
167
-
168
-
169
-
170
-
171
-
172
-
173
-
174
-
175
-
176
-
177
-
178
-
179
-
180
-
 181
181 -
 182
182 -
 183
183 -
 184
184 -
 185
185 -
 186
186 -
 187
187 -
 188
188 -
 189
189 -
 190
190 -
 191
191 -
 192
192 -
 193
193 -
 194
194 -
 195
195 -
 196
196 -
 197
197 -
 198
198 -
 199
199 -
 200
200 -
 201
201 -
202
-
203
-
204
-
205
-
206
-
207
-
208
-
209
-
210
-
211
-
212
-
213
-
214
 |
 |

N
OTE
24 P
ARENT
C
OMPANY
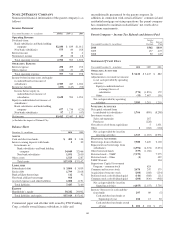
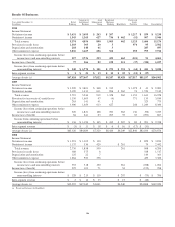
Summarized financial information of the parent company is as
follows:
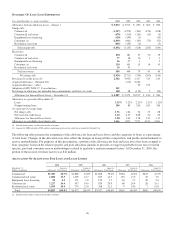
Income Statement
Year ended December 31 - in millions 2010(a) 2009 (a) 2008
Operating Revenue
Dividends from:
Bank subsidiaries and bank holding
company $2,180 $ 839 $1,012
Non-bank subsidiaries 575 84 168
Interest income 12 4
Noninterest income 27 28 18
Total operating revenue 2,782 963 1,202
O
PERATING
E
XPENSE
Interest expense 458 495 152
Other expense (61) 21 46
Total operating expense 397 516 198
Income before income taxes and equity
in undistributed net income of
subsidiaries 2,385 447 1,004
Income tax benefits (253) (147) (50)
Income before equity in
undistributed net income of
subsidiaries 2,638 594 1,054
Equity in undistributed net income of
subsidiaries:
Bank subsidiaries and bank holding
company 677 1,736 (125)
Non-bank subsidiaries 97 117 (47)
Net income $3,412 $2,447 $ 882
(a) Includes the impact of National City.
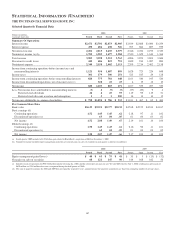
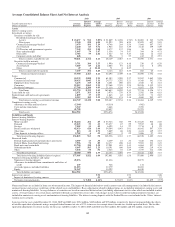
Balance Sheet
December 31 - in millions 2010 2009
A
SSETS
Cash and due from banks $ 401 $ 104
Interest-earning deposits with banks 595
Investments in:
Bank subsidiaries and bank holding
company 34,049 32,966
Non-bank subsidiaries 1,951 2,650
Other assets 1,523 1,287
Total assets $37,929 $37,102
L
IABILITIES
Subordinated debt $ 3,804 $ 3,859
Senior debt 1,799 2,018
Bank affiliate borrowings 112 92
Non-bank affiliate borrowings 964
Accrued expenses and other liabilities 1,008 1,191
Total liabilities 7,687 7,160
E
QUITY
Shareholder’s equity 30,242 29,942
Total liabilities and equity $37,929 $37,102
Commercial paper and all other debt issued by PNC Funding
Corp, a wholly owned finance subsidiary, is fully and
unconditionally guaranteed by the parent company. In
addition, in connection with certain affiliates’ commercial and
residential mortgage servicing operations, the parent company
has committed to maintain such affiliates’ net worth above
minimum requirements.
Parent Company – Income Tax Refunds and Interest Paid
Year ended December 31 (in millions)
Income
Tax
Refunds
Interest
Paid
2010 $342 $419
2009 137 427
2008 92 147
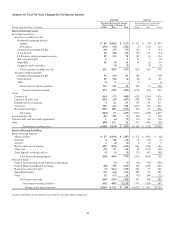
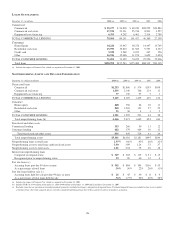
Statement Of Cash Flows
Year ended December 31 - in millions 2010 2009 2008
O
PERATING
A
CTIVITIES
Net income $ 3,412 $ 2,447 $ 882
Adjustments to reconcile net income
to net cash provided by operating
activities:
Equity in undistributed net
(earnings)/losses of
subsidiaries (774) (1,853) 172
Other (53) 2,687 156
Net cash provided by operating
activities 2,585 3,281 1,210
I
NVESTING
A
CTIVITIES
Net capital returned from
(contributed to) subsidiaries 1,766 (899) (8,298)
Investment securities:
Sales and maturities 267
Purchases (228)
Net cash received from acquisitions 5 1,431
Other 1(182) (104)
Net cash provided by (used in)
investing activities 1,767 (1,037) (6,971)
F
INANCING
A
CTIVITIES
Borrowings from subsidiaries 7,580 3,420 2,100
Repayments on borrowings from
subsidiaries (6,596) (4,274) (3,633)
Other borrowed funds (379) (1,166)
Preferred stock – TARP (7,579) 7,275
Preferred stock – Other (1) 492
TARP Warrant 304
Supervisory Capital Assessment
Program – common stock 624
Common and treasury stock 3,474 247 375
Acquisition of treasury stock (204) (188) (234)
Preferred stock cash dividends paid (146) (388) (21)
Common stock cash dividends paid (204) (430) (902)
Net cash provided by (used in)
financing activities (4,055) (2,155) 5,756
Increase (decrease) in cash and due
from banks 297 89 (5)
Cash and due from banks at
beginning of year 104 15 20
Cash and due from banks at end
of year $ 401 $ 104 $ 15
183