PNC Bank 2010 Annual Report Download - page 178
Download and view the complete annual report
Please find page 178 of the 2010 PNC Bank annual report below. You can navigate through the pages in the report by either clicking on the pages listed below, or by using the keyword search tool below to find specific information within the annual report.-
 1
1 -
2
-
3
-
4
-
5
-
6
-
7
-
8
-
9
-
10
-
11
-
12
-
13
-
14
-
15
-
16
-
17
-
18
-
19
-
20
-
21
-
22
-
23
-
24
-
25
-
26
-
27
-
28
-
29
-
30
-
31
-
32
-
33
-
34
-
35
-
36
-
37
-
38
-
39
-
40
-
41
-
42
-
43
-
44
-
45
-
46
-
47
-
48
-
49
-
50
-
51
-
52
-
53
-
54
-
55
-
56
-
57
-
58
-
59
-
60
-
61
-
62
-
63
-
64
-
65
-
66
-
67
-
68
-
69
-
70
-
71
-
72
-
73
-
74
-
75
-
76
-
77
-
78
-
79
-
80
-
81
-
82
-
83
-
84
-
85
-
86
-
87
-
88
-
89
-
90
-
91
-
92
-
93
-
94
-
95
-
96
-
97
-
98
-
99
-
100
-
101
-
102
-
103
-
104
-
105
-
106
-
107
-
108
-
109
-
110
-
111
-
112
-
113
-
114
-
115
-
116
-
117
-
118
-
119
-
120
-
121
-
122
-
123
-
124
-
125
-
126
-
127
-
128
-
129
-
130
-
131
-
132
-
133
-
134
-
135
-
136
-
137
-
138
-
139
-
140
-
141
-
142
-
143
-
144
-
145
-
146
-
147
-
148
-
149
-
150
-
151
-
152
-
153
-
154
-
155
-
156
-
157
-
158
-
159
-
160
-
161
-
162
-
163
-
164
-
165
-
166
-
167
-
 168
168 -
 169
169 -
 170
170 -
 171
171 -
 172
172 -
 173
173 -
 174
174 -
 175
175 -
 176
176 -
 177
177 -
 178
178 -
 179
179 -
 180
180 -
 181
181 -
 182
182 -
 183
183 -
 184
184 -
 185
185 -
 186
186 -
 187
187 -
 188
188 -
189
-
190
-
191
-
192
-
193
-
194
-
195
-
196
-
197
-
198
-
199
-
200
-
201
-
202
-
203
-
204
-
205
-
206
-
207
-
208
-
209
-
210
-
211
-
212
-
213
-
214
 |
 |

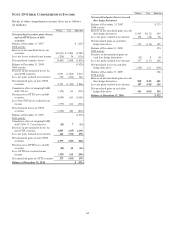
Pretax Tax After-tax
Pension, other postretirement and
postemployment benefit plan
adjustments
Balance at December 31, 2007 $(177)
2008 Activity $(775) $285 (490)
Balance at December 31, 2008 (667)
2009 Activity 198 (73) 125
Balance at December 31, 2009 (542)
2010 Activity 260 (98) 162
Balance at December 31, 2010 $(380)
Other (a)
Balance at December 31, 2007 $ 22
2008 Activity
Foreign currency translation adj. $(129) $ 46 (83)
BlackRock deferred tax adj. 31 31
Total 2008 activity (129) 77 (52)
Balance at December 31, 2008 (30)
2009 Activity
Foreign currency translation adj. 48 (17) 31
BlackRock deferred tax adj. (13) (13)
SBA I/O strip valuation adj. 3 (1) 2
Total 2009 activity 51 (31) 20
Balance at December 31, 2009 (10)
2010 Activity
Foreign currency translation adj. (18) 6 (12)
BlackRock deferred tax adj. 11
SBA I/O strip valuation adj. (2) 1 (1)
Total 2010 activity (20) 8 (12)
Balance at December 31, 2010 $ (22)
(a) Consists of foreign currency translation adjustments, deferred tax adjustments on
BlackRock’s other comprehensive income, and for 2010 and 2009, interest-only
strip valuation adjustments.
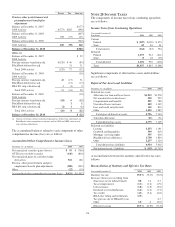
The accumulated balances related to each component of other
comprehensive income (loss) are as follows:
Accumulated Other Comprehensive Income (Loss)
December 31 – in millions 2010 2009
Net unrealized securities gains (losses) $95 $ (760)
OTTI losses on debt securities (646) (816)
Net unrealized gains on cash flow hedge
derivatives 522 166
Pension, other postretirement and post
employment benefit plan adjustments (380) (542)
Other (22) (10)
Accumulated other comprehensive income (loss) $(431) $(1,962)
N
OTE
20 I
NCOME
T
AXES
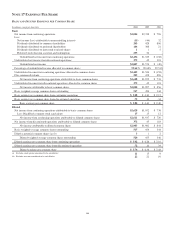
The components of income taxes from continuing operations
are as follows:
Income Taxes from Continuing Operations
Year ended December 31
In millions 2010 2009 2008
Current
Federal $ (207) $(109) $ 473
State 43 46 61
Total current (164) (63) 534
Deferred
Federal 1,193 912 (211)
State 818 (25)
Total deferred 1,201 930 (236)
Total $1,037 $ 867 $ 298
Significant components of deferred tax assets and liabilities
are as follows:
Deferred Tax Assets and Liabilities
December 31 - in millions 2010 2009
Deferred tax assets
Allowance for loan and lease losses $1,912 $1,978
Net unrealized securities losses 320 922
Compensation and benefits 595 788
Unrealized losses on loans 402 1,349
Loss and credit carryforward 145 816
Other 1,422 1,287
Total gross deferred tax assets 4,796 7,140
Valuation allowance (21) (31)
Total deferred tax assets 4,775 7,109
Deferred tax liabilities
Leasing 1,153 1,191
Goodwill and Intangibles 399 619
Mortgage servicing rights 355 618
BlackRock basis difference 1,750 1,850
Other 1,277 1,124
Total deferred tax liabilities 4,934 5,402
Net deferred asset / (liability) $ (159) $1,707
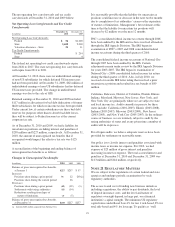
A reconciliation between the statutory and effective tax rates
follows:
Reconciliation of Statutory and Effective Tax Rates
Year ended December 31 2010 2009 2008
Statutory tax rate 35.0% 35.0% 35.0%
Increases (decreases) resulting from
State taxes net of federal benefit 0.8 1.2 2.3
Tax-exempt interest (1.3) (1.2) (1.9)
Life insurance (1.8) (1.9) (2.6)
Dividend received deduction (1.4) (1.2) (3.5)
Tax credits (4.3) (5.4) (4.8)
IRS Letter ruling and settlements (2.5)
Tax gain on sale of Hilliard Lyons 4.7
Other 1.0 .4 (2.0)
Effective tax rate 25.5% 26.9% 27.2%
170