PNC Bank 2010 Annual Report Download - page 161
Download and view the complete annual report
Please find page 161 of the 2010 PNC Bank annual report below. You can navigate through the pages in the report by either clicking on the pages listed below, or by using the keyword search tool below to find specific information within the annual report.-
 1
1 -
2
-
3
-
4
-
5
-
6
-
7
-
8
-
9
-
10
-
11
-
12
-
13
-
14
-
15
-
16
-
17
-
18
-
19
-
20
-
21
-
22
-
23
-
24
-
25
-
26
-
27
-
28
-
29
-
30
-
31
-
32
-
33
-
34
-
35
-
36
-
37
-
38
-
39
-
40
-
41
-
42
-
43
-
44
-
45
-
46
-
47
-
48
-
49
-
50
-
51
-
52
-
53
-
54
-
55
-
56
-
57
-
58
-
59
-
60
-
61
-
62
-
63
-
64
-
65
-
66
-
67
-
68
-
69
-
70
-
71
-
72
-
73
-
74
-
75
-
76
-
77
-
78
-
79
-
80
-
81
-
82
-
83
-
84
-
85
-
86
-
87
-
88
-
89
-
90
-
91
-
92
-
93
-
94
-
95
-
96
-
97
-
98
-
99
-
100
-
101
-
102
-
103
-
104
-
105
-
106
-
107
-
108
-
109
-
110
-
111
-
112
-
113
-
114
-
115
-
116
-
117
-
118
-
119
-
120
-
121
-
122
-
123
-
124
-
125
-
126
-
127
-
128
-
129
-
130
-
131
-
132
-
133
-
134
-
135
-
136
-
137
-
138
-
139
-
140
-
141
-
142
-
143
-
144
-
145
-
146
-
147
-
148
-
149
-
150
-
 151
151 -
 152
152 -
 153
153 -
 154
154 -
 155
155 -
 156
156 -
 157
157 -
 158
158 -
 159
159 -
 160
160 -
 161
161 -
 162
162 -
 163
163 -
 164
164 -
 165
165 -
 166
166 -
 167
167 -
 168
168 -
 169
169 -
 170
170 -
 171
171 -
172
-
173
-
174
-
175
-
176
-
177
-
178
-
179
-
180
-
181
-
182
-
183
-
184
-
185
-
186
-
187
-
188
-
189
-
190
-
191
-
192
-
193
-
194
-
195
-
196
-
197
-
198
-
199
-
200
-
201
-
202
-
203
-
204
-
205
-
206
-
207
-
208
-
209
-
210
-
211
-
212
-
213
-
214
 |
 |

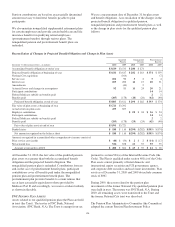
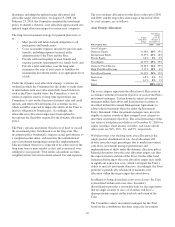
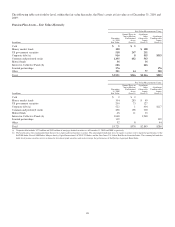
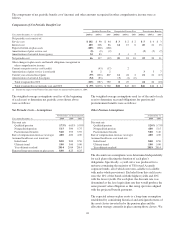
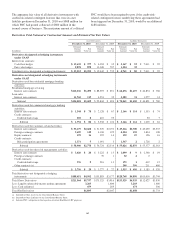
The following table sets forth by level, within the fair value hierarchy, the Plan’s assets at fair value as of December 31, 2010 and
2009:
Pension Plan Assets – Fair Value Hierarchy
Fair Value Measurements Using:
In millions
December
31, 2010
Fair Value
Quoted Prices in
Active Markets
For Identical
Assets
(Level 1)
Significant
Other
Observable
Inputs
(Level 2)
Significant
Unobservable
Inputs
(Level 3)
Cash $5 $5
Money market funds 108 $ 108
US government securities 518 267 251
Corporate debt (a) 916 8 555 $353
Common and preferred stocks 1,195 652 543
Mutual funds 36 36
Interest in Collective Funds (b) 646 646
Limited partnerships 176 176
Other 391 14 77 300
Total $3,991 $946 $2,216 $829
Fair Value Measurements Using:
In millions
December
31, 2009
Fair Value
Quoted Prices in
Active Markets
For Identical
Assets
(Level 1)
Significant
Other
Observable
Inputs
(Level 2)
Significant
Unobservable
Inputs
(Level 3)
Cash $2 $2
Money market funds 334 285 $ 49
US government securities 200 73 127
Corporate debt (a) 522 1 404 $117
Common and preferred stocks 498 198 300
Mutual funds 46 11 35
Interest in Collective Funds (b) 1,948 1,948
Limited partnerships 119 119
Other 52 8 44
Total $3,721 $578 $2,863 $280
(a) Corporate debt includes $175 million and $103 million of mortgage-backed securities as of December 31, 2010 and 2009, respectively.
(b) The benefit plans own commingled funds that invest in equity and fixed income securities. The commingled funds that invest in equity securities seek to mirror the performance of the
S&P 500 Index, Russell 3000 Index, Morgan Stanley Capital International ACWI X US Index, and the Dow Jones U.S. Select Real Estate Securities Index. The commingled fund that
holds fixed income securities invests in domestic investment grade securities and seeks to mimic the performance of the Barclays Aggregate Bond Index.
153