PNC Bank 2010 Annual Report Download - page 197
Download and view the complete annual report
Please find page 197 of the 2010 PNC Bank annual report below. You can navigate through the pages in the report by either clicking on the pages listed below, or by using the keyword search tool below to find specific information within the annual report.-
 1
1 -
2
-
3
-
4
-
5
-
6
-
7
-
8
-
9
-
10
-
11
-
12
-
13
-
14
-
15
-
16
-
17
-
18
-
19
-
20
-
21
-
22
-
23
-
24
-
25
-
26
-
27
-
28
-
29
-
30
-
31
-
32
-
33
-
34
-
35
-
36
-
37
-
38
-
39
-
40
-
41
-
42
-
43
-
44
-
45
-
46
-
47
-
48
-
49
-
50
-
51
-
52
-
53
-
54
-
55
-
56
-
57
-
58
-
59
-
60
-
61
-
62
-
63
-
64
-
65
-
66
-
67
-
68
-
69
-
70
-
71
-
72
-
73
-
74
-
75
-
76
-
77
-
78
-
79
-
80
-
81
-
82
-
83
-
84
-
85
-
86
-
87
-
88
-
89
-
90
-
91
-
92
-
93
-
94
-
95
-
96
-
97
-
98
-
99
-
100
-
101
-
102
-
103
-
104
-
105
-
106
-
107
-
108
-
109
-
110
-
111
-
112
-
113
-
114
-
115
-
116
-
117
-
118
-
119
-
120
-
121
-
122
-
123
-
124
-
125
-
126
-
127
-
128
-
129
-
130
-
131
-
132
-
133
-
134
-
135
-
136
-
137
-
138
-
139
-
140
-
141
-
142
-
143
-
144
-
145
-
146
-
147
-
148
-
149
-
150
-
151
-
152
-
153
-
154
-
155
-
156
-
157
-
158
-
159
-
160
-
161
-
162
-
163
-
164
-
165
-
166
-
167
-
168
-
169
-
170
-
171
-
172
-
173
-
174
-
175
-
176
-
177
-
178
-
179
-
180
-
181
-
182
-
183
-
184
-
185
-
186
-
 187
187 -
 188
188 -
 189
189 -
 190
190 -
 191
191 -
 192
192 -
 193
193 -
 194
194 -
 195
195 -
 196
196 -
 197
197 -
 198
198 -
 199
199 -
 200
200 -
 201
201 -
 202
202 -
 203
203 -
 204
204 -
 205
205 -
 206
206 -
 207
207 -
208
-
209
-
210
-
211
-
212
-
213
-
214
 |
 |

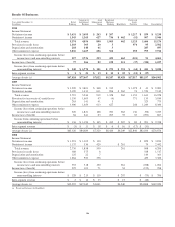
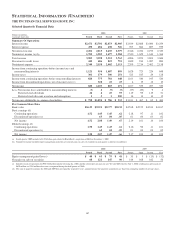
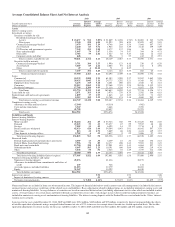
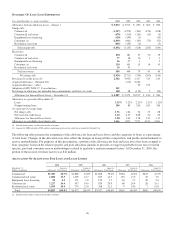
Average Consolidated Balance Sheet And Net Interest Analysis
2010 2009 2008
Taxable-equivalent basis
Dollars in millions
Average
Balances
Interest
Income/
Expense
Average
Yields/
Rates
Average
Balances
Interest
Income/
Expense
Average
Yields/
Rates
Average
Balances
Interest
Income/
Expense
Average
Yields/
Rates
Assets
Interest-earning assets:
Investment securities
Securities available for sale
Residential mortgage-backed
Agency $ 23,437 $ 911 3.89% $ 21,889 $ 1,038 4.74% $ 10,003 $ 545 5.45%
Non-agency 9,240 558 6.04 11,993 780 6.50 12,055 657 5.45
Commercial mortgage-backed 3,679 191 5.19 4,748 264 5.56 5,666 307 5.42
Asset-backed 2,240 83 3.71 1,963 145 7.39 3,126 159 5.09
US Treasury and government agencies 7,549 211 2.80 4,477 137 3.06 50 3 6.00
State and municipal 1,445 79 5.47 1,354 74 5.47 764 36 4.71
Other debt 2,783 79 2.84 1,327 46 3.47 220 12 5.45
Corporate stocks and other 448 398 3 .75 412 12 2.91
Total securities available for sale 50,821 2,112 4.16 48,149 2,487 5.17 32,296 1,731 5.36
Securities held to maturity
Commercial mortgage-backed 3,711 206 5.55 1,990 123 6.18 239 15 6.28
Asset-backed 3,409 89 2.61 2,085 93 4.46 162 8 4.94
Other 49 6 12.24 71 6 8.45 1
Total securities held to maturity 7,169 301 4.20 4,146 222 5.35 402 23 5.72
Total investment securities 57,990 2,413 4.16 52,295 2,709 5.18 32,698 1,754 5.36
Loans
Commercial 54,339 2,888 5.31 61,183 3,288 5.37 31,267 1,862 5.96
Commercial real estate 20,435 1,045 5.11 24,775 1,292 5.21 9,368 542 5.79
Equipment lease financing 6,276 325 5.18 6,201 298 4.81 2,566 81 3.16
Consumer 55,015 2,865 5.21 52,368 2,745 5.24 20,526 1,135 5.53
Residential mortgage 17,709 1,209 6.83 21,116 1,336 6.33 9,017 536 5.94
Total loans 153,774 8,332 5.42 165,643 8,959 5.41 72,744 4,156 5.71
Loans held for sale 2,871 263 9.16 3,976 270 6.79 2,502 166 6.63
Federal funds sold and resale agreements 1,899 37 1.95 1,865 42 2.25 2,472 71 2.87
Other 8,215 185 2.25 14,708 174 1.18 4,068 202 4.97
Total interest-earning assets/interest income 224,749 11,230 5.00 238,487 12,154 5.10 114,484 6,349 5.55
Noninterest-earning assets:
Allowance for loan and lease losses (5,144) (4,316) (962)
Cash and due from banks 3,569 3,648 2,705
Other 41,728 39,057 25,793
Total assets $264,902 $276,876 $142,020
Liabilities and Equity
Interest-bearing liabilities:
Interest-bearing deposits
Money market $ 58,264 261 .45 $ 55,326 548 .99 $ 27,625 566 2.05
Demand 25,025 33 .13 23,477 67 .29 9,947 68 .68
Savings 7,005 13 .19 6,495 14 .22 2,714 8 .29
Retail certificates of deposit 42,933 628 1.46 54,584 1,043 1.91 16,642 597 3.59
Other time 813 22 2.71 5,009 60 1.20 4,424 149 3.37
Time deposits in foreign offices 2,785 6 .22 3,637 9 .25 5,006 97 1.94
Total interest-bearing deposits 136,825 963 .70 148,528 1,741 1.17 66,358 1,485 2.24
Borrowed funds
Federal funds purchased and repurchase agreements 4,309 13 .30 4,439 16 .36 7,228 156 2.16
Federal Home Loan Bank borrowings 7,996 71 .89 14,177 200 1.41 9,303 321 3.45
Bank notes and senior debt 12,790 320 2.50 12,981 443 3.41 6,064 197 3.25
Subordinated debt 9,647 505 5.23 10,191 600 5.89 4,990 219 4.39
Other 5,438 50 .92 2,345 35 1.49 3,737 112 3.00
Total borrowed funds 40,180 959 2.39 44,133 1,294 2.93 31,322 1,005 3.21
Total interest-bearing liabilities/interest expense 177,005 1,922 1.09 192,661 3,035 1.58 97,680 2,490 2.55
Noninterest-bearing liabilities and equity:
Noninterest-bearing deposits 45,076 41,416 18,155
Allowance for unfunded loan commitments and letters of
credit 239 328 134
Accrued expenses and other liabilities 11,015 12,179 10,033
Equity 31,567 30,292 16,018
Total liabilities and equity $264,902 $276,876 $142,020
Interest rate spread 3.91 3.52 3.00
Impact of noninterest-bearing sources .23 .30 .37
Net interest income/margin $ 9,308 4.14% $ 9,119 3.82% $3,859 3.37%
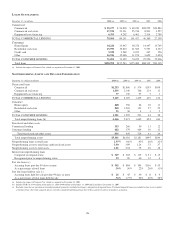
Nonaccrual loans are included in loans, net of unearned income. The impact of financial derivatives used in interest rate risk management is included in the interest
income/expense and average yields/rates of the related assets and liabilities. Basis adjustments related to hedged items are included in noninterest-earning assets and
noninterest-bearing liabilities. Average balances of securities are based on amortized historical cost (excluding adjustments to fair value which are included in other
assets). Average balances for certain loans and borrowed funds accounted for at fair value, with changes in fair value recorded in trading noninterest income, are
included in noninterest-earning assets and noninterest-bearing liabilities. The interest-earning deposits with the Federal Reserve are included in the ‘Other’ interest-
earning assets category.
Loan fees for the years ended December 31, 2010, 2009 and 2008 were $154 million, $162 million and $55 million, respectively. Interest income includes the effects
of taxable-equivalent adjustments using a marginal federal income tax rate of 35% to increase tax-exempt interest income to a taxable-equivalent basis. The taxable-
equivalent adjustments to interest income for the years ended December 31, 2010, 2009 and 2008 were $81 million, $65 million and $36 million, respectively.
189