PNC Bank 2010 Annual Report Download - page 62
Download and view the complete annual report
Please find page 62 of the 2010 PNC Bank annual report below. You can navigate through the pages in the report by either clicking on the pages listed below, or by using the keyword search tool below to find specific information within the annual report.-
 1
1 -
2
-
3
-
4
-
5
-
6
-
7
-
8
-
9
-
10
-
11
-
12
-
13
-
14
-
15
-
16
-
17
-
18
-
19
-
20
-
21
-
22
-
23
-
24
-
25
-
26
-
27
-
28
-
29
-
30
-
31
-
32
-
33
-
34
-
35
-
36
-
37
-
38
-
39
-
40
-
41
-
42
-
43
-
44
-
45
-
46
-
47
-
48
-
49
-
50
-
51
-
 52
52 -
 53
53 -
 54
54 -
 55
55 -
 56
56 -
 57
57 -
 58
58 -
 59
59 -
 60
60 -
 61
61 -
 62
62 -
 63
63 -
 64
64 -
 65
65 -
 66
66 -
 67
67 -
 68
68 -
 69
69 -
 70
70 -
 71
71 -
 72
72 -
73
-
74
-
75
-
76
-
77
-
78
-
79
-
80
-
81
-
82
-
83
-
84
-
85
-
86
-
87
-
88
-
89
-
90
-
91
-
92
-
93
-
94
-
95
-
96
-
97
-
98
-
99
-
100
-
101
-
102
-
103
-
104
-
105
-
106
-
107
-
108
-
109
-
110
-
111
-
112
-
113
-
114
-
115
-
116
-
117
-
118
-
119
-
120
-
121
-
122
-
123
-
124
-
125
-
126
-
127
-
128
-
129
-
130
-
131
-
132
-
133
-
134
-
135
-
136
-
137
-
138
-
139
-
140
-
141
-
142
-
143
-
144
-
145
-
146
-
147
-
148
-
149
-
150
-
151
-
152
-
153
-
154
-
155
-
156
-
157
-
158
-
159
-
160
-
161
-
162
-
163
-
164
-
165
-
166
-
167
-
168
-
169
-
170
-
171
-
172
-
173
-
174
-
175
-
176
-
177
-
178
-
179
-
180
-
181
-
182
-
183
-
184
-
185
-
186
-
187
-
188
-
189
-
190
-
191
-
192
-
193
-
194
-
195
-
196
-
197
-
198
-
199
-
200
-
201
-
202
-
203
-
204
-
205
-
206
-
207
-
208
-
209
-
210
-
211
-
212
-
213
-
214
 |
 |

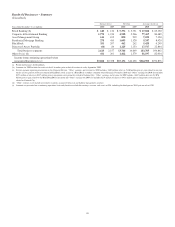
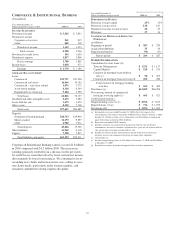
Average deposits were $43.8 billion for 2010, an increase of
$6.3 billion, or 17%, compared with 2009. During 2010,
customers continued to move balances to noninterest-bearing
demand deposits to maintain liquidity.
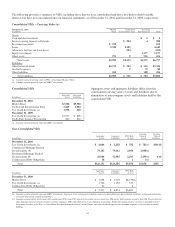
The commercial mortgage servicing portfolio was $266 billion
at December 31, 2010 compared with $287 billion at
December 31, 2009. The decrease was driven by the sale
during the second quarter of 2010 of a duplicative agency
servicing operation acquired with National City.
See the additional revenue discussion regarding treasury
management, capital markets-related products and services,
and commercial mortgage banking activities on page 32.
A
SSET
M
ANAGEMENT
G
ROUP
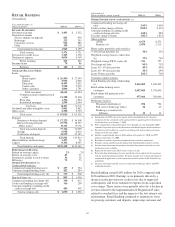
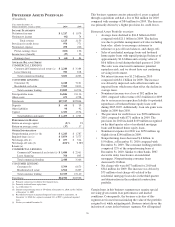
(Unaudited)
Year ended December 31
Dollars in millions except as noted 2010 2009
I
NCOME
S
TATEMENT
Net interest income $ 263 $ 308
Noninterest income 627 611
Total revenue 890 919
Provision for credit losses 20 97
Noninterest expense 647 654
Pretax earnings 223 168
Income taxes 82 63
Earnings $ 141 $ 105
A
VERAGE
B
ALANCE
S
HEET
Loans
Consumer $4,026 $3,957
Commercial and commercial real estate 1,501 1,639
Residential mortgage 850 1,078
Total loans 6,377 6,674
Goodwill and other intangible assets 399 407
Other assets 246 239
Total assets $7,022 $7,320
Deposits
Noninterest-bearing demand $1,324 $1,091
Interest-bearing demand 1,835 1,582
Money market 3,283 3,208
Total transaction deposits 6,442 5,881
Certificates of deposit and other 748 1,076
Total deposits 7,190 6,957
Other liabilities 89 104
Capital 534 569
Total liabilities and equity $7,813 $7,630
P
ERFORMANCE
R
ATIOS
Return on average capital 26% 18%
Return on average assets 2.01 1.43
Noninterest income to total revenue 70 66
Efficiency 73 71
O
THER
I
NFORMATION
Total nonperforming assets (a) (b) $90$ 155
Impaired loans (a) (c) $ 146 $ 198
Total net charge-offs $42$63
Year ended December 31
Dollars in millions except as noted 2010 2009
ASSETS UNDER ADMINISTRATION
(in billions) (a) (d)
Personal $99 $94
Institutional 113 111
Total $212 $205
Asset Type
Equity $115 $100
Fixed Income 63 58
Liquidity/Other 34 47
Total $212 $205
Discretionary assets under management
Personal $69 $67
Institutional 39 36
Total $108 $103
Asset Type
Equity $55 $49
Fixed Income 36 34
Liquidity/Other 17 20
Total $108 $103
Nondiscretionary assets under administration
Personal $30 $27
Institutional 74 75
Total $104 $102
Asset Type
Equity $60 $51
Fixed Income 27 24
Liquidity/Other 17 27
Total $104 $102
(a) As of December 31.
(b) Includes nonperforming loans of $82 million at December 31, 2010 and $149
million at December 31, 2009.
(c) Recorded investment of purchased impaired loans related to acquisitions.
(d) Excludes brokerage account assets.
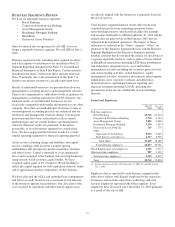
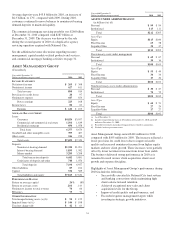
Asset Management Group earned $141 million for 2010
compared with $105 million for 2009. The increase reflected a
lower provision for credit losses due to improved credit
quality and increased noninterest income from higher equity
markets and new client growth. These increases were partially
offset by lower net interest income from lower loan yields.
The business delivered strong performance in 2010 as it
remained focused on new client acquisition, client asset
growth and expense discipline.
Highlights of Asset Management Group’s performance during
2010 include the following:
• Successfully executed its National City trust system
and banking conversions while maintaining high
client satisfaction and retention,
• Achieved exceptional new sales and client
acquisition levels for the Group,
• Improved credit quality and performance, and
• Exceeded expense management targets while
investing in strategic growth initiatives.
54