PNC Bank 2010 Annual Report Download - page 105
Download and view the complete annual report
Please find page 105 of the 2010 PNC Bank annual report below. You can navigate through the pages in the report by either clicking on the pages listed below, or by using the keyword search tool below to find specific information within the annual report.-
 1
1 -
2
-
3
-
4
-
5
-
6
-
7
-
8
-
9
-
10
-
11
-
12
-
13
-
14
-
15
-
16
-
17
-
18
-
19
-
20
-
21
-
22
-
23
-
24
-
25
-
26
-
27
-
28
-
29
-
30
-
31
-
32
-
33
-
34
-
35
-
36
-
37
-
38
-
39
-
40
-
41
-
42
-
43
-
44
-
45
-
46
-
47
-
48
-
49
-
50
-
51
-
52
-
53
-
54
-
55
-
56
-
57
-
58
-
59
-
60
-
61
-
62
-
63
-
64
-
65
-
66
-
67
-
68
-
69
-
70
-
71
-
72
-
73
-
74
-
75
-
76
-
77
-
78
-
79
-
80
-
81
-
82
-
83
-
84
-
85
-
86
-
87
-
88
-
89
-
90
-
91
-
92
-
93
-
94
-
 95
95 -
 96
96 -
 97
97 -
 98
98 -
 99
99 -
 100
100 -
 101
101 -
 102
102 -
 103
103 -
 104
104 -
 105
105 -
 106
106 -
 107
107 -
 108
108 -
 109
109 -
 110
110 -
 111
111 -
 112
112 -
 113
113 -
 114
114 -
 115
115 -
116
-
117
-
118
-
119
-
120
-
121
-
122
-
123
-
124
-
125
-
126
-
127
-
128
-
129
-
130
-
131
-
132
-
133
-
134
-
135
-
136
-
137
-
138
-
139
-
140
-
141
-
142
-
143
-
144
-
145
-
146
-
147
-
148
-
149
-
150
-
151
-
152
-
153
-
154
-
155
-
156
-
157
-
158
-
159
-
160
-
161
-
162
-
163
-
164
-
165
-
166
-
167
-
168
-
169
-
170
-
171
-
172
-
173
-
174
-
175
-
176
-
177
-
178
-
179
-
180
-
181
-
182
-
183
-
184
-
185
-
186
-
187
-
188
-
189
-
190
-
191
-
192
-
193
-
194
-
195
-
196
-
197
-
198
-
199
-
200
-
201
-
202
-
203
-
204
-
205
-
206
-
207
-
208
-
209
-
210
-
211
-
212
-
213
-
214
 |
 |

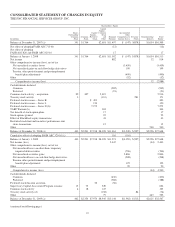
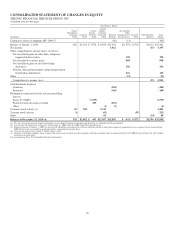
CONSOLIDATED STATEMENT OF CHANGES IN EQUITY
THE PNC FINANCIAL SERVICES GROUP, INC.
Shareholders’ Equity
In millions
Shares
Outstanding
Common
Stock
Common
Stock
Capital
Surplus -
Preferred
Stock
Capital
Surplus -
Common
Stock
and
Other
Retained
Earnings
Accumulated
Other
Comprehensive
Income (Loss)
Treasury
Stock
Noncontrolling
Interests
Total
Equity
Balance at December 31, 2007 (a) 341 $1,764 $2,618 $11,497 $ (147) $(878) $1,654 $16,508
Net effect of adopting FASB ASC 715-60 (12) (12)
Net effect of adopting
FASB ASC 820 and FASB ASC 825-10 17 17
Balance at January 1, 2008 341 $1,764 $2,618 $11,502 $ (147) $(878) $1,654 $16,513
Net income 882 32 914
Other comprehensive income (loss), net of tax
Net unrealized securities losses (3,459) (3,459)
Net unrealized gains on cash flow hedge derivatives 199 199
Pension, other postretirement and postemployment
benefit plan adjustments (490) (490)
Other (52) (52)
Comprehensive income (loss) 32 (2,888)
Cash dividends declared
Common (902) (902)
Preferred (21) (21)
Common stock activity – acquisition 99 497 5,419 5,916
Treasury stock activity 3 (110) 281 171
Preferred stock issuance – Series K $ 493 493
Preferred stock issuance – Series L 150 150
Preferred stock issuance – Series N (b) 7,275 7,275
TARP Warrant (b) 304 304
Tax benefit of stock option plans 17 17
Stock options granted 22 22
Effect of BlackRock equity transactions 43 43
Restricted stock/unit and incentive/ performance unit
share transactions 15 15
Other 540 540
Balance at December 31, 2008 (a) 443 $2,261 $7,918 $8,328 $11,461 $(3,949) $(597) $2,226 $27,648
Cumulative effect of adopting FASB ASC 320-10 (c) 110 (110)
Balance at January 1, 2009 443 $2,261 $7,918 $8,328 $11,571 $(4,059) $(597) $2,226 $27,648
Net income (loss) 2,447 (44) 2,403
Other comprehensive income (loss), net of tax
Net unrealized losses on other-than- temporary
impaired debt securities (706) (706)
Net unrealized securities gains 2,866 2,866
Net unrealized losses on cash flow hedge derivatives (208) (208)
Pension, other postretirement and postemployment
benefit plan adjustments 125 125
Other 20 20
Comprehensive income (loss) (44) 4,500
Cash dividends declared
Common (430) (430)
Preferred (388) (388)
Preferred stock discount accretion 56 (56)
Supervisory Capital Assessment Program issuance 15 75 549 624
Common stock activity 4 18 147 165
Treasury stock activity (d) (158) 84 (74)
Other 79 443 522
Balance at December 31, 2009 (a) 462 $2,354 $7,974 $8,945 $13,144 $(1,962) $(513) $2,625 $32,567
(continued on following page)
97